UNIQA provides life and health insurance and is active in almost all areas of property and casualty insurance. UNIQA serves around 8.7 million customers, has over 17.4 million insurance policies with a premium volume written (including the savings portion of unit- and index-linked life insurance) of around € 5.5 billion (2011: € 5.5 billion) and investments of € 26.3 billion (2011: € 24.6 billion). UNIQA is the second-largest insurer in Austria and has a strong network in CEE with a presence in 16 countries.
Premium development
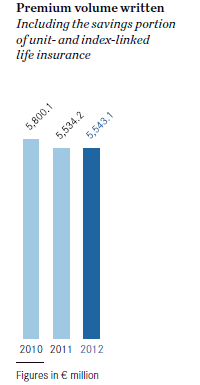
Despite a downturn in the area of single premiums, UNIQA’s total premium volume, including the savings portion of unit- and index-linked life insurance in the amount of € 679.0 million (2011: € 633.9 million), increased slightly by 0.2 per cent to € 5,543.1 million (2011: € 5,534.2 million). By contrast, the total consolidated premium volume written declined marginally by 0.7 per cent to € 4,864.2 million (2011: € 4,900.2 million).
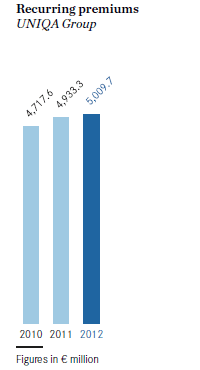
There was satisfactory development in the area of insurance policies with recurring premiums, which grew by 1.5 per cent to € 5,009.7 million (2011: € 4,933.3 million). Although the deterioration in the single-premium business was slowed in 2012, the volume declined by 11.2 per cent to € 533.5 million as a result of the extension of the minimum holding period to benefit from tax advantages in Austria and the planned reduction in business in Poland (2011: € 600.9 million).
Group premiums earned, including the savings portion of unit- and index-linked life insurance (after reinsurance) in the amount of € 649.9 million (2011: € 599.7 million), rose by 0.2 per cent to € 5,273.8 million (2011: € 5,264.7 million). Retained premiums earned (in accordance with IFRS) declined by 0.9 per cent to € 4,623.9 million (2011: € 4,665.0 million).
In the 2012 financial year, 45.9 per cent (2011: 43.5 per cent) of the premium volume written were attributable to property and casualty insurance, 16.4 per cent (2011: 15.9 per cent) to health insurance and 37.7 per cent (2011: 40.6 per cent) to life insurance.
In Austria, the premium volume written, including the savings portion of unit- and index-linked life insurance, fell by 3.2 per cent to € 3,566.2 million in 2012 (2011: € 3,685.8 million). Recurring premiums declined by 2.0 per cent to € 3,474.0 million (2011: € 3,545.8 million). Single premiums declined by 34.2 per cent to € 92.1 million (2011: € 140.0 million) due to the aforementioned extension of the minimum holding period to benefit from tax advantages.
Including the savings portion of unit- and index-linked life insurance, premiums earned in Austria amounted to € 3,470.7 million (2011: € 3,595.5 million). Retained premiums earned (in accordance with IFRS) declined by 0.6 per cent to € 3,113.2 million in 2012 (2011: € 3,132.9 million).
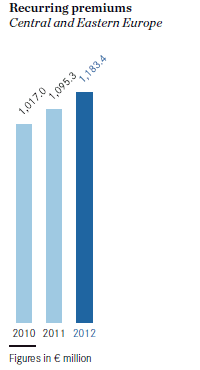
In 2012, the main growth drivers in CEE were property and casualty insurance and health insurance. Growth was dampened by the downward trend in the single-premium business in life insurance. The premium volume written, including the savings portion of unit- and index-linked life insurance, declined by 4.5 per cent to € 1,295.5 million in 2012 (2011: € 1,240.1 million). Recurring premiums increased sharply by 8.0 per cent to € 1,183.4 million (2011: € 1,095.3 million). By contrast, single premiums declined by 22.6 per cent to € 112.1 million (2011: € 144.8 million). In 2012, the share of Group premiums written attributable to CEE increased to 23.4 per cent (2011: 22.4 per cent).
Including the savings portion of unit- and index-linked life insurance, premiums earned in CEE increased by 3.8 per cent to € 1,205.5 million (2011: € 1,160.9 million). Retained premiums earned (in accordance with IFRS) amounted to € 1,077.5 million (2011: € 1,047.4 million).
In Western Europe, the premium volume written, including the savings portion of unit- and index-linked life insurance (excluding the Mannheimer Group in Germany, which is not included in these figures in accordance with IFRS 5), increased by 12.0 per cent to € 681.5 million in the 2012 financial year (2011: € 608.3 million); this was due in particular to the positive development in the property and casualty insurance business in Italy. Recurring premium business also developed extremely positively in this region, increasing by a strong 20.6 per cent to € 352.3 million (2011: € 292.2 million), while single premiums rose by 4.2 per cent to € 329.2 million (2011: € 316.1 million). All in all, Western Europe accounted for 12.3 per cent of Group premiums written in 2012 (2011: 11.0 per cent).
Including the savings portion of unit- and index-linked life insurance, premiums earned in Western Europe increased by 6.3 per cent to € 408.5 million (2011: € 384.3 million). By contrast, retained premiums earned (in accordance with IFRS) declined by 10.6 per cent to € 433.1 million (2011: € 484.7 million).
Development of insurance benefits
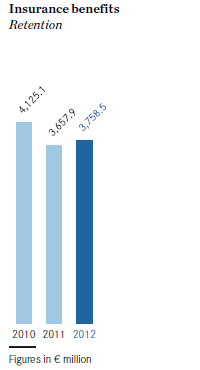
The volume of insurance benefits before reinsurance (see Note 36 of the Notes to the Consolidated Financial Statements) rose by 2.9 per cent to € 3,873.8 million in the 2012 financial year due to the increase in the number of major claims and claims due to natural disasters (2011: € 3,763.0 million). Consolidated retained insurance benefits increased by 2.8 per cent to € 3,758.5 million in the past financial year (2011: € 3,657.9 million).
In 2012, retained insurance benefits in Austria increased by 9.3 per cent to € 2,715.2 million (2011: € 2,484.0 million), while the figure for the Central and Eastern European countries fell by 5.8 per cent to € 644.8 million (2011: € 684.6 million). In the Western European markets, insurance benefits (after reinsurance) also fell by 18.5 per cent to € 398.6 million (2011: € 489.3 million).
Operating expenses
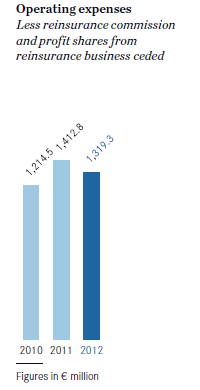
Total consolidated operating expenses (see Note 37 of the Notes to the Consolidated Financial Statements) less reinsurance commission and profit shares from reinsurance business ceded (see Note 33 of the Notes to the Consolidated Financial Statements) declined by 6.6 per cent to € 1,319.3 million in the 2012 financial year (2011: € 1,412.8 million). Reflecting the volume of new business and the change in the product mix, acquisition expenses increased by 4.5 per cent to € 955.8 million (2011: € 914.3 million). Other operating expenses less reinsurance commission received fell by 27.1 per cent to € 363.5 million (2011: € 498.4 million). This development includes the first positive effects from UNIQA 2.0 projects.
In Austria, operating expenses decreased by 16.1 per cent to € 775.5 million (2011: € 923.9 million). The figure for CEE was € 435.4 million (2011: € 404.0 million), a year-on-year increase of 7.7 per cent. By contrast, operating expenses in the Western European countries increased by 27.8 per cent to € 108.4 million (2011: € 84.8 million).
UNIQA’s cost ratio after reinsurance, i.e. the ratio of total operating expenses to Group premiums earned, including the savings portion of unit- and index-linked life insurance, decreased to 25.0 per cent in the past year as a result of the developments mentioned above (2011: 26.8 per cent). The cost ratio before reinsurance was 24.5 per cent (2011: 26.2 per cent).
Investment result
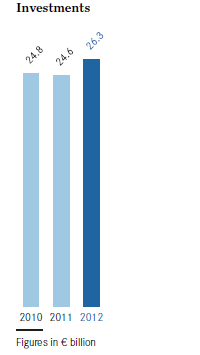
Total investments, including land and buildings used by the Group, real estate held as investments, shares in associates and investments of the unit- and index-linked life insurance and current cash and cash equivalents, increased by 6.9 per cent to € 26,307.6 million in the 2012 financial year (31 December 2011: € 24,601.1 million).
Net investment income increased by 292.2 per cent to € 791.5 million as a result of the good development on the financial markets (2011: € 201.8 million). A detailed presentation of investment income can be found in the Notes to the Consolidated Financial Statements (Note 34).
Earnings before taxes of € 205.4 million
UNIQA generated a highly satisfactory profit/loss on ordinary activities of € 205.4 million in the 2012 financial year (2011: minus € 322.3 million). The net profit/loss for the period amounted to € 169.8 million (2011: minus € 243.8 million). Consolidated net profit/loss increased to € 130.2 million (2011: minus € 245.6 million). This figure includes the result from discontinued operations of € 10.4 million due to the disposal of the Mannheimer Group. Earnings per share amounted to € 0.77 (2011: minus € 1.73). The Management Board will therefore propose the payment of a dividend of € 0.25 per share to the Supervisory Board and the Annual General Meeting.
Group equity and total assets
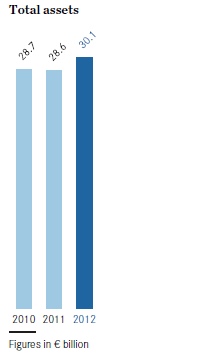
In the past financial year, total Group equity increased by 84.2 per cent or € 922.0 million to € 2,017.6 million as a result of the capital increase implemented in 2012 and the encouraging investment result (31 December 2011: € 1,095.6 million). This figure includes minority interests of € 22.3 million (31 December 2011: € 219.7 million). Accordingly, the solvency ratio (Solvency I) increased to 214.9 per cent (31 December 2011: 122.5 per cent). Total Group assets increased by 5.1 per cent in the year under review to a total of € 30,037.2 million as of 31 December 2012 (31 December 2011: € 28,567.7 million).
Cash flow
In 2012, net cash from operating activities amounted to € 1,133.0 million (2011: € 393.9 million). Net cash used in investing activities amounted to € 1,185.5 million (2011: € 186.4 million). The increase in the share capital meant that net cash from financing activities increased to € 335.0 million (2011: minus € 58.3 million).
The total change in cash and cash equivalents was € 282.5 million (2011: € 149.2 million). At the end of 2012, the Group had cash and cash equivalents in the amount of € 960.1 million (2011: € 683.1 million).
Employees
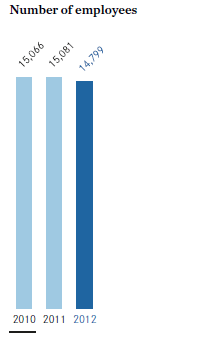
In 2012, the average number of employees at UNIQA fell to 14,799 (2011: 15,081). Of this figure, 6,329 (2011: 6,179) were employed in sales positions. The number of employees in administrative roles decreased to 8,470 (2011: 8,902).
In the 2012 financial year, the Group had 2,963 employees (2011: 2,978) in the Central European (CE) region – consisting of Poland, Slovakia, Czech Republic and Hungary –, 2,279 employees (2011: 1,982) in the Southeastern European (SEE) region – consisting of Albania, Bosnia and Herzegovina, Bulgaria, Kosovo, Croatia, Macedonia, Montenegro and Serbia – and 2,509 employees (2011: 2,273) in the Eastern European (EE) region, i.e. Romania and Ukraine. There were 61 employees (2011: 56) in Russia (RU). The average number of employees in the Western European markets decreased to 334 due to the disposal of the Mannheimer Group (2011: 1,067). A total of 6,653 people were employed in Austria (2011: 6,725). Including the employees of the general agencies working exclusively for UNIQA, the total number of people working for the Group amounted to 22,070.
In 2012, 53 per cent of the employees in Austria working in administrative positions were female. In sales, the male-female ratio was 80:20. 21 per cent (2011: 23 per cent) of employees worked on a part-time basis. The average age of the workforce remained at 42 years in the year under review (2011: 42 years). In total, 14.1 per cent (2011: 12.1 per cent) of the employees participated in UNIQA’s bonus system in 2011 – a variable remuneration system that is linked both to the success of the company and to personal performance. UNIQA also offers young people in training the opportunity to get to know foreign cultures and make international contacts. 50 apprentices are currently being trained, and a total of 14 new apprentices were accepted in 2012.
