
UNIQA Group at a glance
Consolidated key figures
In € million |
2016 |
2015 |
Change |
||||||||
|
|||||||||||
Premiums written |
4,643.1 |
4,829.0 |
–3.9% |
||||||||
Savings portions from unit-linked and index-linked life insurance (before reinsurance) |
405.1 |
382.0 |
+6.0% |
||||||||
Premiums written including savings portions from unit-linked and index-linked life insurance |
5,048.2 |
5,211.0 |
–3.1% |
||||||||
of which property and casualty insurance |
2,518.4 |
2,439.2 |
+3.2% |
||||||||
of which health insurance |
1,003.7 |
964.4 |
+4.1% |
||||||||
of which life insurance |
1,526.1 |
1,807.5 |
–15.6% |
||||||||
of which recurring premiums |
1,356.9 |
1,366.9 |
–0.7% |
||||||||
of which single premiums |
169.2 |
440.6 |
–61.6% |
||||||||
Premiums written including savings portions from unit-linked and index-linked life insurance |
5,048.2 |
5,211.0 |
–3.1% |
||||||||
of which UNIQA Austria |
3,631.5 |
3,883.5 |
–6.5% |
||||||||
of which UNIQA International |
1,399.9 |
1,302.8 |
+7.5% |
||||||||
of which reinsurance |
1,130.8 |
1,112.1 |
+1.7% |
||||||||
of which consolidation |
–1,113.9 |
–1,087.3 |
+2.4% |
||||||||
|
|
|
|
||||||||
Premiums earned (net)1) |
4,443.0 |
4,651.1 |
–4.5% |
||||||||
of which property and casualty insurance |
2,359.1 |
2,301.3 |
+2.5% |
||||||||
of which health insurance |
1,000.4 |
963.9 |
+3.8% |
||||||||
of which life insurance |
1,083.6 |
1,386.0 |
–21.8% |
||||||||
Savings portions from unit-linked and index-linked life insurance (after reinsurance) |
384.7 |
365.9 |
+5.1% |
||||||||
Premiums earned including savings portions from unit-linked and index-linked life insurance |
4,827.7 |
5,017.0 |
–3.8% |
||||||||
|
|
|
|
||||||||
Net insurance benefits |
–3,385.6 |
–3,671.3 |
–7.8% |
||||||||
of which property and casualty insurance |
–1,550.6 |
–1,553.7 |
–0.2% |
||||||||
of which health insurance |
–843.6 |
–781.7 |
+7.9% |
||||||||
of which life insurance |
–991.4 |
–1,335.9 |
–25.8% |
||||||||
|
|
|
|
||||||||
Operating expenses (net)2) |
–1,286.4 |
–1,190.4 |
8.1% |
||||||||
of which property and casualty insurance |
–763.2 |
–699.6 |
+9.1% |
||||||||
of which health insurance |
–175.5 |
–153.7 |
+14.2% |
||||||||
of which life insurance |
–347.7 |
–337.1 |
+3.1% |
||||||||
Cost ratio (net after reinsurance) |
26.6% |
23.7% |
– |
||||||||
|
|
|
|
||||||||
Combined ratio (net after reinsurance) |
98.1% |
97.9% |
– |
||||||||
|
|
|
|
||||||||
Net investment income |
588.9 |
732.0 |
–19.5% |
||||||||
|
|
|
|
||||||||
Profit/loss on ordinary activities |
225.5 |
397.8 |
–43.3% |
||||||||
Net profit/loss |
149.6 |
340.7 |
–56.1% |
||||||||
Consolidated profit/loss |
148.1 |
337.2 |
–56.1% |
||||||||
|
|
|
|
||||||||
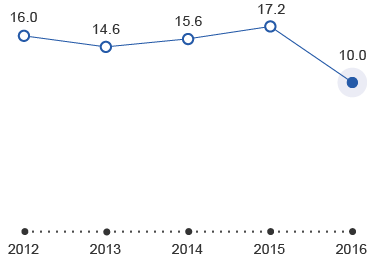
Operating return on equity |
10.0% |
17.2% |
– |
||||||||
|
|
|
|
||||||||
Investments3) |
25,454.6 |
29,416.1 |
–13.5% |
||||||||
Shareholders’ equity |
3,186.3 |
3,144.5 |
+1.3% |
||||||||
Equity including non-controlling interests |
3,212.8 |
3,166.4 |
1.5% |
||||||||
Technical provisions (net)4) |
21,812.7 |
25,638.9 |
–14.9% |
||||||||
Total assets |
33,639.2 |
33,297.9 |
1.0% |
||||||||
|
|
|
|
||||||||
Number of insurance contracts |
18,785,051 |
19,254,690 |
–2.4% |
||||||||
Average number of employees |
12,855 |
13,782 |
–6.7% |
||||||||
Premiums written
In € million
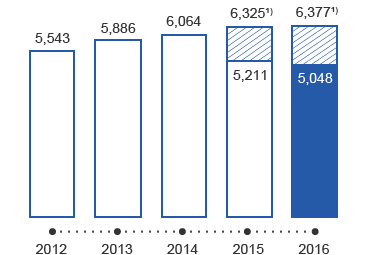

1) Including Italy
(Including savings portions from unit-linked and index-linked life insurance)
Combined ratio
In percent
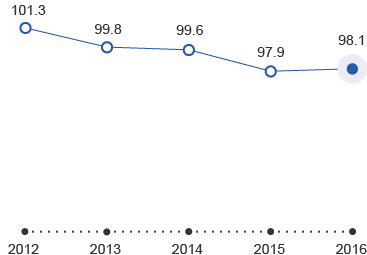

(After reinsurance)
Earnings before taxes
In € million
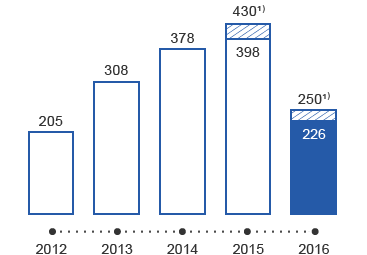

1) Including Italy
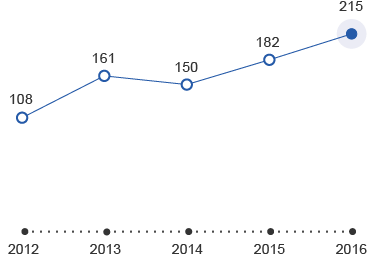
Economic capital ratio (ECR ratio)
In percent

Dividend per share
In €
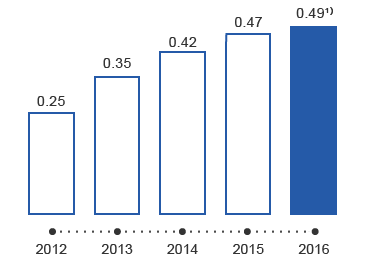

1) Proposal to the Annual General Meeting
Operating return on equity
In percent

Definitions of the essential key figures can be found in the glossary.
In € million |
2012 |
2013 |
2014 |
2015 |
2016 |
||
|
|||||||
Premiums written, including savings portions from unit-linked and index-linked life insurance |
5,543 |
5,886 |
6,064 |
5,211 |
5,048 |
||
of which property and casualty insurance |
2,546 |
2,591 |
2,621 |
2,439 |
2,518 |
||
of which health insurance |
909 |
938 |
961 |
964 |
1,004 |
||
of which life insurance |
2,088 |
2,357 |
2,483 |
1,807 |
1,526 |
||
Insurance benefits (net) |
–3,759 |
–3,959 |
–4,384 |
–3,671 |
–3,386 |
||
of which property and casualty insurance |
–1,639 |
–1,634 |
–1,724 |
–1,554 |
–1,551 |
||
of which health insurance |
–756 |
–769 |
–781 |
–782 |
–844 |
||
of which life insurance |
–1,363 |
–1,557 |
–1,880 |
–1,336 |
–991 |
||
Operating expenses (net) |
–1,319 |
–1,354 |
–1,299 |
–1,190 |
–1,286 |
||
of which property and casualty insurance |
–787 |
–803 |
–749 |
–700 |
–763 |
||
of which health insurance |
–139 |
–162 |
–167 |
–154 |
–175 |
||
of which life insurance |
–394 |
–389 |
–383 |
–337 |
–348 |
||
Combined ratio after reinsurance (in per cent) |
101.3% |
99.8% |
99.6% |
97.9% |
98.1% |
||
Claims rate (in per cent) |
68.4% |
66.9% |
69.4% |
67.5% |
65.7% |
||
Cost ratio (in per cent) |
32.9% |
32.9% |
30.2% |
30.4% |
32.4% |
||
Net investment income |
791 |
780 |
888 |
732 |
589 |
||
Earnings before taxes |
204 |
308 |
378 |
398 |
226 |
||
of which property and casualty insurance |
–12 |
47 |
61 |
71 |
58 |
||
of which health insurance |
103 |
84 |
130 |
171 |
96 |
||
of which life insurance |
113 |
177 |
187 |
155 |
72 |
||
Consolidated profit/(loss) |
127 |
285 |
290 |
337 |
148 |
||
Earnings per share (in €) |
0.75 |
1.21 |
0.94 |
1.09 |
0.48 |
||
Dividend per share (in €) |
0.25 |
0.35 |
0.42 |
0.47 |
0.491) |
||
Equity (portion attributable to shareholders of UNIQA Insurance Group AG) |
2,009 |
2,763 |
3,082 |
3,145 |
3,186 |
||
Total assets |
30,055 |
31,002 |
33,038 |
33,298 |
33,639 |
||
Operating return on equity (in per cent) |
16.0% |
14.6% |
15.6% |
17.2% |
10.0% |
||
Economic capital ratio – ECR ratio (in per cent) |
108% |
161% |
150% |
182% |
215% |
||