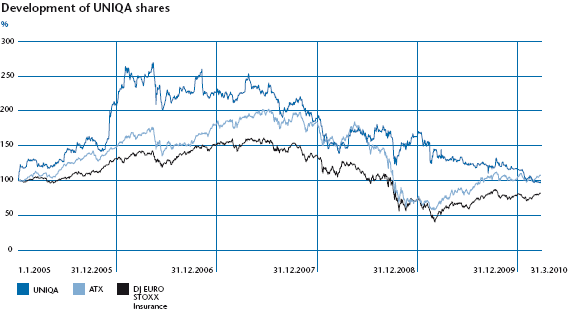
Within the continued turbulence on the capital markets, the UNIQA shares fell relatively far in value in 2009, contrary to the market trend. However, the interest of analysts and investors remained high.
| Download Excel |
|
UNIQA key figures |
2009 |
2008 |
2007 |
2006 |
2005 | ||
| |||||||
|
Stock market price of UNIQA shares as at 31 Dec. |
12.97 |
18.06 |
20.95 |
25.09 |
23.40 | ||
|
High |
18.86 |
21.46 |
28.10 |
29.86 |
23.65 | ||
|
Low |
12.21 |
13.50 |
20.36 |
22.35 |
10.60 | ||
|
Average trading value/day (€ million) |
0.5 |
1.0 |
3.4 |
4.7 |
3.1 | ||
|
Market capitalisation as at 31 Dec. (€ million) |
1,855 |
2,378 |
2,509 |
3,005 |
2,803 | ||
|
Earnings per share |
0.11 |
0.44 |
2.07 |
1.27 |
0.94 | ||
|
Dividend per share |
0.401) |
0.40 |
0.50 |
0.35 |
0.26 | ||

