|
Figures in € million |
2013 |
2012 |
Change |
||||||||
|
|||||||||||
|
Premiums written |
5,157.6 |
4,864.2 |
+6.0 % |
||||||||
|
Savings portion of premiums from unit- and index-linked life insurance (gross before reinsurance) |
727.9 |
679.0 |
+7.2 % |
||||||||
|
Premiums written including the savings portion from unit- and index-linked life insurance |
5,885.5 |
5,543.1 |
+6.2 % |
||||||||
|
of which property and casualty insurance |
2,590.5 |
2,545.9 |
+1.8 % |
||||||||
|
of which health insurance |
937.6 |
909.1 |
+3.1 % |
||||||||
|
of which life insurance |
2,357.4 |
2,088.1 |
+12.9 % |
||||||||
|
of which recurring premiums |
1,674.6 |
1,554.6 |
+7.7 % |
||||||||
|
of which single-premium business |
682.8 |
533.5 |
+28.0 % |
||||||||
|
Premiums written including the savings portion from unit- and index-linked life insurance |
5,885.5 |
5,543.1 |
+6.2 % |
||||||||
|
of which UNIQA Austria |
2,806.7 |
2,708.2 |
+3.6 % |
||||||||
|
of which Raiffeisen Insurance |
878.5 |
819.4 |
+7.2 % |
||||||||
|
of which UNIQA International |
2,162.4 |
1,942.8 |
+11.3 % |
||||||||
|
of which reinsurance |
1,633.1 |
1,280.0 |
+27.6 % |
||||||||
|
of which Group functions and consolidation |
–1,595.1 |
–1,207.2 |
+32.1 % |
||||||||
|
|
|
|
|
||||||||
|
Premiums earned (net)1) |
4,935.9 |
4,623.9 |
+6.7 % |
||||||||
|
of which property and casualty insurance |
2,438.8 |
2,394.4 |
+1.9 % |
||||||||
|
of which health insurance |
936.1 |
903.0 |
+3.7 % |
||||||||
|
of which life insurance |
1,560.9 |
1,326.5 |
+17.7 % |
||||||||
|
Savings portion of premiums from unit- and index-linked life insurance (net after reinsurance) |
702.3 |
649.9 |
+8.1 % |
||||||||
|
Premiums earned (net) including the savings portion of premiums from unit- and index-linked life insurance |
5,638.2 |
5,273.8 |
+6.9 % |
||||||||
|
|
|
|
|
||||||||
|
–3,955.3 |
–3,758.5 |
+5.2 % |
|||||||||
|
of which property and casualty insurance |
–1,633.8 |
–1,638.8 |
–0.3 % |
||||||||
|
of which health insurance |
–768.7 |
–756.5 |
+1.6 % |
||||||||
|
of which life insurance |
–1,552.7 |
–1,363.2 |
+13.9 % |
||||||||
|
|
|
|
|
||||||||
|
Operating expenses (net)2) |
–1,357.6 |
–1,319.3 |
+2.9 % |
||||||||
|
of which property and casualty insurance |
–803.4 |
–786.8 |
+2.1 % |
||||||||
|
of which health insurance |
–162.0 |
–138.6 |
+16.9 % |
||||||||
|
of which life insurance |
–392.2 |
–393.9 |
–0.4 % |
||||||||
|
Cost ratio (after reinsurance) |
24.1 % |
25.0 % |
– |
||||||||
|
|
|
|
|
||||||||
|
Combined ratio (after reinsurance) |
99.9 % |
101.3 % |
– |
||||||||
|
|
|
|
|
||||||||
|
Net investment income |
780.0 |
791.4 |
–1.4 % |
||||||||
|
|
|
|
|
||||||||
|
Profit from ordinary activities |
305.6 |
204.2 |
+49.7 % |
||||||||
|
Net profit/loss |
286.8 |
166.5 |
+72.3 % |
||||||||
|
Consolidated profit |
283.4 |
127.1 |
+123.0 % |
||||||||
|
|
|
|
|
||||||||
|
Return on equity (ROE) after taxes and minority interests |
11.9 % |
8.8 % |
– |
||||||||
|
|
|
|
|
||||||||
|
Investments3) |
27,383.6 |
26,326.0 |
+4.0 % |
||||||||
|
Equity |
2,767.7 |
2,009.3 |
+37.7 % |
||||||||
|
Total equity including minority interests |
2,789.9 |
2,030.0 |
+37.4 % |
||||||||
|
Technical provisions (net)4) |
24,183.9 |
23,759.3 |
+1.8 % |
||||||||
|
Total assets |
31,068.6 |
30,054.6 |
+3.4 % |
||||||||
|
|
|
|
|
||||||||
|
Number of insurance policies |
18,556,615 |
17,439,608 |
+6.4 % |
||||||||
|
Average number of employees |
14,277 |
14,795 |
–3.5 % |
||||||||
Premium volume written by operating segment 2013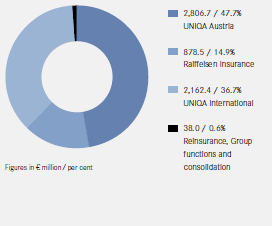 |
Shareholder structure of UNIQA Insurance Group AG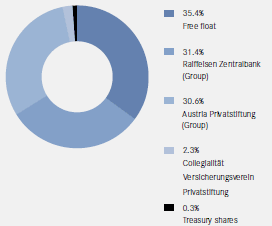 |
Development of UNIQA shares
")
Key figures for UNIQA shares
|
2013 |
2012 |
2011 |
2010 |
2009 |
|||
|
Figures in € |
|
|
|
|
|
||
|
|||||||
|
UNIQA’s share price on 31 December |
9.28 |
9.86 |
9.42 |
14.70 |
12.97 |
||
|
High |
11.14 |
13.40 |
16.50 |
15.34 |
18.86 |
||
|
Low |
8.12 |
8.75 |
9.00 |
10.68 |
12.21 |
||
|
Average turnover/day (in € million) |
1.5 |
0.1 |
0.1 |
0.5 |
0.5 |
||
|
Market capitalisation as at 31 December (in € million) |
2,867.5 |
2,112.5 |
1,346.9 |
2,102.0 |
1,855.0 |
||
|
1.20 |
0.75 |
–1.73 |
0.30 |
0.19 |
|||
|
Dividend per share |
0.351) |
0.25 |
0 |
0.40 |
0.40 |
||