|
in € million |
2014 |
2013 |
Change |
||||||||
|
|||||||||||
|
Premiums written |
5,519.7 |
5,157.6 |
+7.0% |
||||||||
|
Savings portions from unit-linked and index-linked life insurance (before reinsurance) |
544.7 |
727.9 |
–25.2% |
||||||||
|
Premiums written including savings portions from unit-linked and index-linked life insurance |
6,064.4 |
5,885.5 |
+3.0% |
||||||||
|
of which property and casualty insurance |
2,620.9 |
2,590.5 |
+1.2% |
||||||||
|
of which health insurance |
960.8 |
937.6 |
+2.5% |
||||||||
|
of which life insurance |
2,482.7 |
2,357.4 |
+5.3% |
||||||||
|
of which income from regular premiums |
1,521.0 |
1,674.6 |
–9.2% |
||||||||
|
of which single premiums |
961.6 |
682.8 |
+40.8% |
||||||||
|
Premiums written including savings portions from unit-linked and index-linked life insurance |
6,064.4 |
5,885.5 |
+3.0% |
||||||||
|
of which UNIQA Österreich |
2,773.5 |
2,806.7 |
–1.2% |
||||||||
|
of which Raiffeisen Insurance |
905.3 |
878.5 |
+3.1% |
||||||||
|
of which UNIQA International AG |
2,353.1 |
2,162.4 |
+8.8% |
||||||||
|
of which reinsurance |
1,189.3 |
1,633.1 |
–27.2% |
||||||||
|
of which of which Group functions and consolidation |
–1,156.9 |
–1,595.1 |
–27.5% |
||||||||
|
|
|
|
|
||||||||
|
Premiums earned (net)1) |
5,312.9 |
4,938.6 |
+7.6% |
||||||||
|
of which property and casualty insurance |
2,482.9 |
2,441.5 |
+1.7% |
||||||||
|
of which health insurance |
960.0 |
936.2 |
+2.5% |
||||||||
|
of which life insurance |
1,870.0 |
1,560.9 |
+19.8% |
||||||||
|
Savings portions from unit-linked and index-linked life insurance (after reinsurance) |
526.1 |
702.3 |
–25.1% |
||||||||
|
Premiums earned including savings portions from unit-linked and index-linked life insurance |
5,839.0 |
5,640.9 |
+3.5% |
||||||||
|
|
|
|
|
||||||||
|
–4,383.7 |
–3,959.4 |
+10.7% |
|||||||||
|
of which property and casualty insurance |
–1,723.6 |
–1,633.8 |
+5.5% |
||||||||
|
of which health insurance |
–780.5 |
–768.7 |
+1.5% |
||||||||
|
of which life insurance |
–1,879.6 |
–1,556.9 |
+20.7% |
||||||||
|
|
|
|
|
||||||||
|
Operating expenses (net)2) |
–1,275.3 |
–1,354.2 |
–5.8% |
||||||||
|
of which property and casualty insurance |
–746.1 |
–803.2 |
–7.1% |
||||||||
|
of which health insurance |
–163.4 |
–162.1 |
+0.8% |
||||||||
|
of which life insurance |
–365.9 |
–388.9 |
–5.9% |
||||||||
|
Cost ratio (after reinsurance) |
21.8% |
24.0% |
– |
||||||||
|
|
|
|
|
||||||||
|
Combined ratio (after reinsurance) |
99.5% |
99.8% |
– |
||||||||
|
|
|
|
|
||||||||
|
Net investment income |
864.4 |
780.0 |
+10.8% |
||||||||
|
|
|
|
|
||||||||
|
Profit/(loss) from ordinary activities |
377.9 |
307.6 |
+22.9% |
||||||||
|
Profit/(loss) for the year |
292.9 |
287.9 |
+1.7% |
||||||||
|
Consolidated profit/(loss) |
289.9 |
284.7 |
+1.8% |
||||||||
|
|
|
|
|
||||||||
|
Return on equity (ROE) after taxes and non-controlling interests |
9.9% |
11.9% |
– |
||||||||
|
|
|
|
|
||||||||
|
Investments3) |
29,212.7 |
27,383.6 |
+6.7% |
||||||||
|
Equity |
3,082.2 |
2,763.1 |
+11.5% |
||||||||
|
Total equity including non-controlling interests |
3,102.4 |
2,785.1 |
+11.4% |
||||||||
|
Technical provisions (net)4) |
25,629.6 |
24,208.8 |
+5.9% |
||||||||
|
Total assets |
33,038.2 |
31,001.7 |
+6.6% |
||||||||
|
|
|
|
|
||||||||
|
Number of insurance contracts |
19,214,570 |
18,556,615 |
+3.5% |
||||||||
|
Average number of employees |
14,336 |
14,277 |
+0.4% |
||||||||
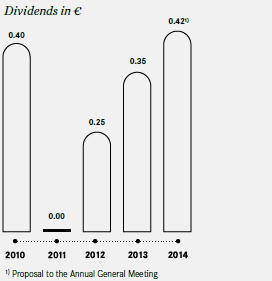
History of UNIQA dividends
 |
 |
UNIQA share performance
")
UNIQA shares – key figures
|
in € |
2014 |
2013 |
2012 |
2011 |
2010 |
||
|
|||||||
|
UNIQA share price as at 31 December |
7.78 |
9.28 |
9.86 |
9.42 |
14.70 |
||
|
High |
10.02 |
11.14 |
13.40 |
16.50 |
15.34 |
||
|
Low |
7.34 |
8.12 |
8.75 |
9.00 |
10.68 |
||
|
Average turnover/day (in € million) |
3.2 |
1.5 |
0.1 |
0.1 |
0.5 |
||
|
Market capitalisation as at 31/12 (in € million) |
2,404.0 |
2,867.5 |
2,112.5 |
1,346.9 |
2,102.0 |
||
|
0.94 |
1.21 |
0.75 |
–1.73 |
0.30 |
|||
|
Dividend per share |
0.421) |
0.35 |
0.25 |
0 |
0.40 |
||