The methods of the internal ECM model are used to determine the risk profile in the UNIQA Group. The last assessment produced the following risk profile for the UNIQA Group:
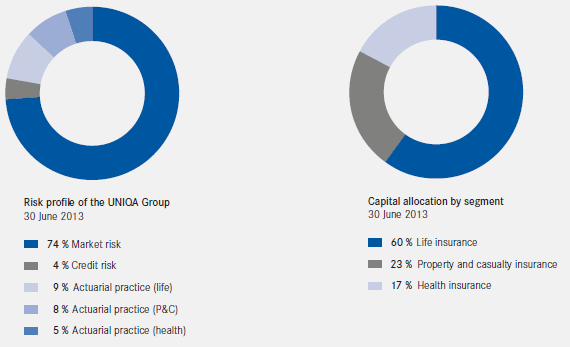
The risk profile of the UNIQA Group is very strongly influenced by life insurance and health insurance holdings in the Austrian life and health insurance companies UNIQA Österreich and Raiffeisen Versicherung. This situation means that market risk plays a central role in the UNIQA Group’s risk profile. The composition of market risk is described in the section “Market risk”.
The subsidiaries in Central Europe (CE: Hungary, Czech Republic, Slovakia and Poland) operate insurance businesses in the property and casualty segment and the life and health insurance segment.
In the Southeastern European (SEE) and Eastern European (EE) regions, insurance business is currently primarily in the property and casualty segment and particularly in motor vehicle insurance.
This situation is important to the UNIQA Group because it creates a high level of diversification for the life and health insurance lines, which are dominated by the Austrian companies.
The risk-specific particularities of the regions are also manifested in the risk profiles ascertained by the internal measurement approach.
After every calculation for life, non-life and composite insurers in the UNIQA Group, reference profiles are created and compared with the risk profile for the respective companies.
The reference profiles show that, for composite insurers, the relationship between market and actuarial risk is balanced. In addition, the highest diversification effect was achieved among the composite insurers.
Market risk
Market risk is powerfully influenced by the risk of changing interest rates, particularly in the life insurance line. This is primarily the result of different terms of assets and liabilities. The course has already been successfully set for a substantial reduction of the interest rate risk by establishing an ALM process and implementing an ALM-based asset allocation. The measures taken in 2013 have already significantly reduced the interest rate risk and the strategic decisions for 2014 intend to make further improvements in this area.
Spread risk represents another major risk. This is the risk of price volatility due to changes in credit risk premiums. On the basis of equity requirements under Solvency II, structured securitisations constitute a particularly significant risk. In the case of bonds, it is primarily securities with lower ratings and longer durations that contribute to a heightened spread risk. The implemented ALM processes and the liability-driven investment approach are associated with a partial increase in spread risk in addition to the significant reduction of the interest rate risk. This is managed actively on the basis of the available market risk management tools in the context of risk-bearing capacity and included in the decision-making and management.
The UNIQA Group’s share risk was greatly reduced because of the reduction in asset classes such as hedge funds and private equity and now plays a more superordinate role similar to currency and concentration risk.
Several measures were implemented in previous years with regard to the methods and processes for managing these risks. These included the introduction of quarterly ALM committee meetings at the top management level, the restructuring and continuous development of investment limits, the improvement of existing market and credit risk models and their automation.
Description of market risk categories:
Interest risk: due to the investment structure and the high proportion of interest-bearing titles, the interest rate risk forms a very important component of the financial risks. The following table shows the interest-bearing securities and the average interest coupons arranged by the most important investment categories and their average coupon interest rate on the reporting date.
|
Average interest coupon |
EUR |
USD |
Other |
|||
|
Figures in per cent |
2013 |
2012 |
2013 |
2012 |
2013 |
2012 |
|
Fixed interest securities |
|
|
|
|
|
|
|
High-grade bonds |
3.1 |
3.4 |
3.8 |
3.1 |
4.8 |
5.2 |
|
Bank/company bonds |
3.4 |
3.7 |
5.4 |
5.2 |
4.5 |
4.1 |
|
Emerging markets bonds |
|
3.7 |
|
5.6 |
|
6.3 |
|
High-yield bonds |
|
7.5 |
|
5.3 |
|
4.5 |
|
Other investments |
3.1 |
3.1 |
2.3 |
2.4 |
0.0 |
1.6 |
Long-term policies and life insurance policies with guaranteed interest and profit sharing
Insurance policies with guaranteed interest and additional profit sharing contain the risk that the guaranteed interest rate will not be achieved over a sustained period of time. Capital income produced over and above the guaranteed interest rate will be shared between the policyholder and the insurance company, with the policyholder receiving an appropriate share of the profit. The following table shows the comparison of assets and debts for such insurance policies.
|
Investments for long-term life insurance policies with guaranteed interest and profit sharing |
31.12.2013 |
31.12.2012 |
|
Figures in € thousand |
|
|
|
Annuities |
11,692,539 |
10,492,471 |
|
Shares |
209,640 |
393,948 |
|
Alternatives |
51,851 |
506,641 |
|
Holdings |
389,504 |
397,019 |
|
Loans |
693,791 |
781,614 |
|
Real estate |
1,262,475 |
1,292,474 |
|
Liquidity |
769,876 |
1,192,161 |
|
Deposits receivable |
124,163 |
128,078 |
|
Total |
15,193,839 |
15,184,406 |
|
Difference between book value and market value |
|
|
|
Real estate |
561,033 |
489,308 |
|
Loans |
19,869 |
15,277 |
|
Provisions and liabilities from long-term life insurance policies with guaranteed interest and profit sharing |
31.12.2013 |
31.12.2012 |
|
Figures in € thousand |
|
|
|
13,656,600 |
13,493,296 |
|
|
Provision for profit-unrelated premium refunds |
2,723 |
2,388 |
|
Provision for profit-related premium refunds, i.e. policyholder profit sharing |
289,855 |
511,310 |
|
Other technical provisions |
26,347 |
25,563 |
|
132,429 |
129,117 |
|
|
Deposits payable |
405,528 |
426,886 |
|
Total |
14,513,483 |
14,588,559 |
The following table shows the structure of the remaining terms of interest-bearing securities and loans.
|
Remaining term |
31.12.2013 |
31.12.2012 |
|
Figures in € thousand |
|
|
|
Up to 1 year |
1,534,645 |
861,944 |
|
Of more than 1 year up to 3 years |
1,456,554 |
1,503,088 |
|
Of more than 3 years up to 5 years |
1,791,829 |
2,225,739 |
|
Of more than 5 years up to 7 years |
1,125,538 |
1,381,584 |
|
Of more than 7 years up to 10 years |
2,048,289 |
3,112,406 |
|
Of more than 10 years up to 15 years |
1,383,222 |
864,415 |
|
More than 15 years |
3,046,253 |
1,324,909 |
|
Total |
12,386,330 |
11,274,086 |
Long-term unit-linked and index-linked life insurance policies
In the segment of unit-linked and index-linked life insurance, the interest income and all fluctuations in value of the dedicated investments are reflected in the technical provisions. There is therefore no financial risk from the point of view of the insurer. The following table shows the investment structure of financial investments that are used to cover the technical provisions arising from unit-linked and index-linked life insurance policies.
|
Investments in unit-linked and index-linked life insurance policies |
31.12.2013 |
31.12.2012 |
|
Figures in € thousand |
|
|
|
Share-based funds |
1,148,769 |
1,069,691 |
|
Bond funds |
4,040,844 |
3,846,087 |
|
Liquidity |
99,776 |
66,904 |
|
Other investments |
91,811 |
84,145 |
|
Total |
5,381,201 |
5,066,828 |
Long-term health insurance policies
The actuarial interest rate for the actuarial provision in health insurance lines, which is selected depending on the type of life insurance, is 3.0 per cent. However, this interest rate is not guaranteed and can, upon presentation of proof to the insurance supervisory authority, be reduced to any lower capital income that may be expected. The following table shows the investment structure available to cover insurance liabilities.
|
Investments for long-term health insurance policies |
31.12.2013 |
31.12.2012 |
|
Figures in € thousand |
|
|
|
Annuities |
1,759,068 |
1,466,342 |
|
Shares |
39,044 |
38,076 |
|
Alternatives |
5,564 |
92,450 |
|
Holdings |
200,575 |
201,955 |
|
Loans |
176,935 |
193,036 |
|
Real estate |
299,113 |
311,661 |
|
Liquidity |
268,565 |
188,717 |
|
Total |
2,748,864 |
2,492,237 |
|
Difference between book value and market value |
|
|
|
Real estate |
81,824 |
86,477 |
|
Loans |
–24,821 |
6,106 |
|
Provisions and liabilities from long-term health insurance policies |
31.12.2013 |
31.12.2012 |
|
Figures in € thousand |
|
|
|
Actuarial provision |
2,326,671 |
2,218,575 |
|
Provision for profit-unrelated premium refunds |
10,108 |
10,298 |
|
Provision for profit-related premium refunds, i.e. policyholder profit sharing |
44,319 |
43,927 |
|
Other technical provisions |
806 |
885 |
|
Provision for unearned premiums |
17,362 |
20,395 |
|
Provision for outstanding claims |
169,756 |
168,322 |
|
Deposits payable |
985 |
1,091 |
|
Total |
2,570,006 |
2,463,495 |
Property and casualty insurance policies
Most property and casualty insurance policies are short-term. The technical provisions are not discounted, meaning that no interest is calculated for the short-term investment. The average terms of interest-bearing securities and loans invested to cover technical provisions are shown in the following table.
|
Remaining term |
31.12.2013 |
31.12.2012 |
|
Figures in € thousand |
|
|
|
Up to 1 year |
601,828 |
325,267 |
|
Of more than 1 year up to 3 years |
448,551 |
506,506 |
|
Of more than 3 years up to 5 years |
375,405 |
446,859 |
|
Of more than 5 years up to 7 years |
298,517 |
266,051 |
|
Of more than 7 years up to 10 years |
243,908 |
372,516 |
|
Of more than 10 years up to 15 years |
95,876 |
72,932 |
|
More than 15 years |
471,277 |
146,623 |
|
Total |
2,535,362 |
2,136,754 |
Credit risk
When investing in securities, we invest in debt securities of varying quality, taking into consideration the yield prospects and risks. The following table shows the quality structure of fixed-interest investments.
|
Rating |
31.12.2013 |
31.12.2012 |
|
Figures in € thousand |
|
|
|
AAA |
4,569,254 |
4,072,974 |
|
AA |
2,837,120 |
2,528,971 |
|
A |
3,519,567 |
3,137,296 |
|
BBB |
3,713,019 |
3,309,737 |
|
BB |
963,252 |
858,631 |
|
B |
615,865 |
548,974 |
|
CCC |
113,790 |
101,431 |
|
Not rated |
369,076 |
328,990 |
|
Total |
16,700,944 |
14,887,004 |
The values as at 31 December 2013 include the securities reclassified to the category of loans with a value of € 788,061 thousand (2012: € 906,435 thousand).
Equity price risk
When investing in stock markets, the risk is diversified by using various management styles (total return approach, benchmark-oriented approach, value growth approach and industry- and region-specific and fundamental title selection). For the purpose of securing the investment, the effective investment ratio is controlled through the use of derivative financial instruments. The following table shows the investment structure of the share portfolios by asset classes.
|
Share portfolio composition |
31.12.2013 |
31.12.2012 |
||||
|
Figures in € thousand |
|
|
||||
|
||||||
|
Shares in Europe |
313,384 |
391,321 |
||||
|
Shares in America |
62,511 |
26,964 |
||||
|
Shares in Asia |
40,267 |
9,091 |
||||
|
Shares international1) |
3,556 |
18,224 |
||||
|
Shares in emerging markets |
7,393 |
10,270 |
||||
|
Shares total return2) |
15,486 |
179,200 |
||||
|
Other shares |
28,840 |
17,532 |
||||
|
Total |
471,437 |
652,603 |
||||
Currency risk
The UNIQA Group invests in securities in a wide range of currencies. Although the insurance business is operated in different countries, the foreign currency risks of the investments do not always correspond to the currency risks of the technical provisions and liabilities. Investments in US dollars bring about the greatest amount at risk. The following table shows a breakdown of assets and debts by currency.
|
31.12.2013 |
EUR |
USD |
Other |
Total |
|
Figures in € thousand |
|
|
|
|
|
Assets |
|
|
|
|
|
Investments |
23,676,605 |
1,805,019 |
1,902,025 |
27,383,649 |
|
Other tangible assets |
70,320 |
|
17,836 |
88,156 |
|
Intangible assets |
1,303,297 |
|
159,233 |
1,462,530 |
|
Share of reinsurance in the technical provisions |
909,780 |
|
32,678 |
942,458 |
|
Other assets |
960,261 |
|
231,582 |
1,191,842 |
|
Total |
26,920,262 |
1,805,019 |
2,343,353 |
31,068,634 |
|
|
|
|
|
|
|
Provisions and liabilities |
|
|
|
|
|
Subordinated liabilities |
600,000 |
|
0 |
600,000 |
|
Technical provisions |
23,213,343 |
|
1,912,992 |
25,126,335 |
|
Other provisions |
820,804 |
|
15,876 |
836,681 |
|
Liabilities |
1,569,638 |
|
146,053 |
1,715,691 |
|
Total |
26,203,786 |
0 |
2,074,921 |
28,278,707 |
|
31.12.2012 |
EUR |
USD |
Other |
Total |
|
Figures in € thousand |
|
|
|
|
|
Assets |
|
|
|
|
|
Investments |
23,863,863 |
444,210 |
2,017,941 |
26,326,015 |
|
Other tangible assets |
90,682 |
|
21,922 |
112,604 |
|
Intangible assets |
1,271,890 |
|
145,835 |
1,417,725 |
|
Share of reinsurance in the technical provisions |
945,169 |
|
69,495 |
1,014,665 |
|
Other assets |
894,620 |
|
288,926 |
1,183,546 |
|
Total |
27,066,224 |
444,210 |
2,544,119 |
30,054,554 |
|
|
|
|
|
|
|
Provisions and liabilities |
|
|
|
|
|
Subordinated liabilities |
450,000 |
|
0 |
450,000 |
|
Technical provisions |
22,931,199 |
|
1,842,751 |
24,773,950 |
|
Other provisions |
844,174 |
|
26,835 |
871,009 |
|
Liabilities |
1,747,899 |
|
181,744 |
1,929,644 |
|
Total |
25,973,272 |
0 |
2,051,331 |
28,024,603 |
The fair value of securities investments in US dollars amounted to € 1,805 million as at 31 December 2013 (2012: € 2,176 million). The exchange rate risk decreased through derivative financial instruments to € 355 million (2012: € 444 million), and the hedging ratio was 80 per cent (2012: 61.6 per cent). This decline is based on a deliberate reduction of the foreign currency risk.
Liquidity risk
As the UNIQA Group is required to satisfy its payment obligations on a daily basis, a precise liquidity schedule is prepared for a period of one year. A minimum liquidity holding is defined by the Management Board and made available as a cash reserve on a daily basis.
In addition, the majority of the securities portfolio is listed on liquid stock exchanges and can be sold quickly in the case of liquidity burdens without significant liquidity deductions. When the remaining maturities stipulated by contract for investing fixed-interest securities (see Notes number 9) are chosen, the existing remaining contractual maturities (see 4.2.1 Interest rate risk) are taken into consideration in the various business segments.
Additional payment obligations exist for private equity investments in the amount of € 1.0 million (2012: € 61.0 million).
Sensitivities
Market and credit risk management is a fixed component in the structured investment process. In particular, stress tests and sensitivity analyses are used as key figures for measuring, observing and actively controlling the risk in addition to the established market and credit risk models (SCR, ECR, etc.).
The table below shows the most important market risks in the form of key sensitivity figures; the information is presented as available on the reporting date, meaning that only rough figures can be offered for future losses of fair value. Depending on the assessment principle to be applied, if there are any future fair value losses, they can lead to different fluctuations in equity that are with or without an effect on the income statement. The key figures are calculated theoretically on the basis of actuarial principles and do not take into consideration any diversification effects between the individual market risks or counter-controlled measures taken in the various market scenarios.
|
Interest rate risk |
31.12.2013 |
31.12.2012 |
||
|
Figures in € thousand |
+100 basis points |
–100 basis points |
+100 basis points |
–100 basis points |
|
High-grade bonds |
–669,323 |
746,714 |
–494,579 |
566,752 |
|
Bank/company bonds |
–128,246 |
128,288 |
–92,036 |
99,447 |
|
Emerging markets bonds |
|
|
–59,715 |
66,150 |
|
High-yield bonds |
–40,717 |
54,234 |
–1,575 |
1,728 |
|
Total |
–838,286 |
929,236 |
–647,905 |
734,077 |
|
Equity risk |
31.12.2013 |
31.12.2012 |
||
|
Figures in € thousand |
10% |
–10% |
10% |
–10% |
|
Shares in Europe |
30,930 |
–30,930 |
28,359 |
–28,364 |
|
Shares in America |
6,213 |
–6,166 |
3,405 |
–3,405 |
|
Shares in Asia |
|
|
3,145 |
–3,145 |
|
Shares international |
|
|
135 |
–135 |
|
Shares in emerging markets |
|
|
2,911 |
–2,911 |
|
Shares total return |
|
|
1,515 |
–1,515 |
|
Derivative financial instruments and other shares |
11,639 |
–11,862 |
195 |
–195 |
|
Total |
48,782 |
–48,958 |
39,665 |
–39,671 |
|
Currency risk |
31.12.2013 |
31.12.2012 |
||
|
Figures in € thousand |
10% |
–10% |
10% |
–10% |
|
EUR |
0 |
0 |
0 |
0 |
|
USD |
33,794 |
–33,740 |
44,390 |
–44,390 |
|
Other |
75,787 |
–76,061 |
159,981 |
–159,981 |
|
Total |
109,582 |
–109,801 |
204,371 |
–204,371 |
|
Credit risk |
|
31.12.2013 |
31.12.2012 |
||
|
Figures in € thousand |
|
+ |
– |
+ |
– |
|
AAA |
0 basis points |
0 |
0 |
0 |
0 |
|
AA |
25 basis points |
–51,287 |
53,207 |
–23,691 |
24,314 |
|
A |
50 basis points |
–64,108 |
66,281 |
–72,696 |
76,358 |
|
BAA |
75 basis points |
–161,979 |
182,828 |
–99,814 |
107,158 |
|
BA |
100 basis points |
–29,373 |
31,249 |
–26,255 |
28,594 |
|
B |
125 basis points |
–9,622 |
–437 |
–16,613 |
18,580 |
|
CAA |
150 basis points |
16,910 |
26,417 |
–1,771 |
2,740 |
|
Not rated |
100 basis points |
50,247 |
–8,902 |
1,006 |
24,324 |
|
Total |
|
–249,213 |
350,644 |
–239,834 |
282,069 |
Value at risk (VaR)
The overall market risk of the investment portfolio is determined on the basis of the value-at-risk approach. The key figure is calculated for a confidence interval of 95.0 per cent and a holding term of one year. The basic data is in the form of historical figures from the last calendar year with a balancing of the individual values (decay factor of 1).
The following table shows the key value-at-risk figures for the last financial year as reporting date values, annual average and maxima/minima for the year.
|
Total value at risk |
Equity risk |
Currency risk |
Interest rate risk |
||
|
Figures in € thousand |
|||||
|
31.12.2013 |
1,014,436 |
56,835 |
227,817 |
1,010,510 |
–280,726 |
|
31.12.2012 |
959,523 |
236,108 |
219,466 |
940,800 |
–436,851 |
|
Lowest |
917,218 |
56,835 |
227,817 |
912,696 |
–200,441 |
|
Average |
963,689 |
158,914 |
288,175 |
952,190 |
–334,034 |
|
Highest |
1,014,436 |
242,528 |
365,953 |
1,010,510 |
–610,148 |
Evaluation of the stock of Asset-Backed Securities
The UNIQA Group holds 1.8 per cent (2012: 2.3 per cent) of its investments in asset-backed securities (ABS). Model risks are associated with the valuation of ABS securities.
The securities held in the direct portfolio and fund portfolio are mostly valued using a mark-to-model method.
The individual transactions vary with regard to structure, risk profile, interest claims, rating and other parameters.
Direct transfer of such prices does not appropriately take into account either the complexity or the heterogeneity of the different structures. For these reasons, UNIQA has decided to set the fair value of the specified papers by means of a model approach.
ABS papers are noted for being highly complex and are therefore extensively documented. Due to its longstanding activity in the area of securitisation, UNIQA has developed various models on its own or with others that permit high-quality analyses at acceptable expense.
The main parameters of the model for assessing the value of ABS are estimates of the future development of the (financial) economic environment, especially the speed of repayment, the failure frequency, the failure severity and the discount rate.
All parameters refer to the assets used to collateralise the transaction, i.e. to the corporate credits, bonds, preferential shares, etc. The future payments are calculated using external forecasts for failure rates. The modelling system of Moody’s Analytics, which represents a widely accepted market standard, serves as the basis for the analysis. UNIQA now uses the forecasts of Moody’s Investors Service for forecasting the failure rates of companies. These forecasts encompass a period of five years each. Other parameters besides the failure rates are calibrated with the help of the data history. Objective and predetermined values are used for the discounting.
To this extent, the losses expected by an investor on a transaction are already taken into consideration when the payment streams are generated. In order to depict an additional risk discount, a risk premium above the pure interest rate was added to the applied discount rate. This premium corresponds to the surcharge originally applied on execution of the individual transaction.
The sensitivity analysis of the ABS portfolio with regard to a rise or a fall in the failure rates in the investments underlying the ABS structures is also based on the forecast values from Moody’s Investors Service.
The sensitivities for these securities subjected to model-based analysis are also determined using Moody’s failure scenarios. According to Moody’s, these failure scenarios correspond to the 10.0 per cent quantile or the 90.0 per cent quantile of the distribution function of the failures.
|
Sensitivity analysis |
Upside |
Downside |
|
Figures in € million |
|
|
|
Total profit/loss |
0.3 |
–2.3 |
|
on P&L |
0.0 |
–2.8 |
|
on equity |
0.3 |
0.5 |
Valuation of STRABAG SE
UNIQA has a participating interest in STRABAG SE of 14.7 per cent as at the reporting date of 31 December 2013 (31 December 2012: 14.9 per cent). Even following the re-entry of a major investor, UNIQA retained a significant influence over the business activity of STRABAG SE. UNIQA is therefore continuing the participating interest in STRABAG SE as an associated share. In the fourth quarter of 2010, purchase options were conceded to a strategic investor for an additional 1.4 million individual shares of STRABAG SE. They can be exercised between July 2012 and July 2014. In 2013, 0.2 million of these options were exercised.
The valuation on the reporting date takes place in consideration of the option agreement and the expected proportional equity on the reporting date. The current market value of the option was determined as the difference between the current book value and the price for exercising the option.
|
Book value STRABAG SE |
2013 |
||
|
Figures in € thousand |
|
||
|
|||
|
As at 1 Jan. |
468,953 |
||
|
Disposal |
–4,017 |
||
|
Updating affecting income1) |
20,951 |
||
|
Updating not affecting income |
–11,343 |
||
|
Dividends |
–3,136 |
||
|
As at 31 Dec. |
471,407 |
||
|
Value in € per share |
28.1 |
||
Information on Hypo Alpe Adria
In mid-March 2014, the Austrian federal government announced that the nationalised Hypo Alpe Adria bank is to be wound down via a “bad bank”. A default on the part of the bank has been ruled out of the time being. Currently, the impact of this solution on bonds held by UNIQA cannot be reliably estimated, as information on any involvement of government- or state-guaranteed bonds is pending both politically and legally.
|
Collateralisation |
Market value |
Book value IFRS |
||
|
Figures in € thousand |
|
|
||
|
||||
|
Federal guarantee |
13,549 |
13,549 |
||
|
Guarantee of province |
52,215 |
52,720 |
||
|
No guarantee |
1,000 |
1,000 |
||
|
Total |
66,765 |
67,269 |
||
Information on investments in Ukrainian government bonds
The current political uncertainty in Ukraine due to the fall of the government and the dispute with Russia over Crimea puts further servicing of government debts into question to some extent. In early March 2014, the European Union held out the prospect of assisting Ukraine with up to € 11 billion. This would mean all payments from government bonds could be serviced in 2014. The relatively low exposure to Ukrainian government bonds is also due to the fact that high liquidity holdings are held in UNIQA’s Ukrainian subsidiaries because of the uncertainty/poor rating of government bonds.
|
Ukraine |
Market values |
IFRS book value |
|
Figures in € thousand |
|
|
|
Ukrainian government bonds |
9,958 |
9,958 |
Asset Liability Management (ALM)
Market and credit risks have different weightings and various degrees of seriousness, depending on the investment structure. The effects of the financial risks on the value of the investments also influence the level of technical liabilities. A partial dependence therefore exists between the growth of assets and liabilities from insurance policies. UNIQA monitors the income expectations and risks of assets and liabilities arising from insurance policies as part of the asset liability management (ALM) process. The aim is to achieve a return on capital that is sustainably higher than the updated technical liabilities, while retaining the greatest possible security. Here, assets and debts are allocated to different accounting groups. The following table shows the main accounting groups generated by the various product categories.
|
Investments |
31.12.2013 |
31.12.2012 |
|
Figures in € thousand |
|
|
|
Long-term life insurance policies with guaranteed interest and profit sharing |
15,193,839 |
15,184,406 |
|
Long-term unit-linked and index-linked life insurance policies |
5,381,201 |
5,066,828 |
|
Long-term health insurance policies |
2,748,864 |
2,492,237 |
|
Short-term property and casualty insurance policies |
4,059,744 |
3,582,544 |
|
Total |
27,383,649 |
26,326,015 |
These values refer to the following balance sheet items:
A. I. Self-used land and buildings
B. Land and buildings held as financial investments
D. Shares in associated companies
E. Investments
F. Investments in unit-linked and index-linked life insurance policies
L. Liquid funds
|
Technical provisions and liabilities (retained) |
31.12.2013 |
31.12.2012 |
|
Figures in € thousand |
|
|
|
Long-term life insurance policies with guaranteed interest and profit sharing |
14,513,483 |
14,588,559 |
|
Long-term unit-linked and index-linked life insurance policies |
5,299,625 |
4,983,029 |
|
Long-term health insurance policies |
2,570,006 |
2,463,495 |
|
Short-term property and casualty insurance policies |
2,597,934 |
2,561,018 |
|
Total |
24,981,048 |
24,596,101 |
These values refer to the following balance sheet items:
C. Technical provisions
D. Technical provisions for unit-linked and index-linked life insurance
G. I. Reinsurance liabilities (only deposit liabilities held under reinsurance business ceded)
G. Share of reinsurance in technical provisions
H. Share of reinsurance in technical provisions for unit-linked and index-linked life insurance
Actuarial risks
Non-life
Actuarial risk in non-life includes premium, reserve and catastrophic risk. Premium risk is defined as the risk of future benefits from insured events exceeding the assumptions of the premium calculation. The result is incorrect pricing for an insurance product that leads to a loss.
The reserve risk is defined as the risk that actuarial provisions for damage claims that have already occurred were not sufficient.
Catastrophic risk is defined as the risk that financial losses may occur due to natural disaster events such as storms, hail, flooding or earthquakes. These events affect a number of policyholders at once, yet do not occur on a constant basis. These events are described as low-frequency/high-severity claims.
The greatest actuarial risk in non-life in the Group is held by UNIQA Österreich and UNIQA Re. In CEE, SEE and EE, non-life business, particularly motor vehicle insurance, is at the forefront; this means that the actuarial risk of non-life is foremost in these companies.
A major risk for the UNIQA Group is the risk of natural disasters. Storm-related catastrophes are especially relevant for the north of Austria and the Czech Republic.
In addition, risks of catastrophic flooding and earthquakes are of major significance for markets in Austria, Czech Republic, Poland, Hungary, Romania and Bulgaria.
This risk is managed accordingly with analyses of exposure to catastrophes and inclusion of such considerations in product and price formation, as well as the provisioning of appropriate reinsurance capacity.
Profitability in the core business is a decisive factor.
In the risk management process for actuarial risks in the non-life segment, standardised monitoring systems supervise Group risk management and Group actuarials monitor actuarial risks of premium risk and reserve risk on a periodic basis.
The Group segments for risk management and Group actuarials support the local companies by providing Group-wide standardised tools and professional training and education.
Use of the internal non-life partial model will represent an essential element in risk assessment and further risk management in the medium term. This risk model quantifies premium, reserve and catastrophic risk by means of a Monte Carlo simulation procedure. This quantification is conducted at insurance branch level (sector), at company level and Group level.
In addition to risk figures relevant for risk management, this risk model also delivers the economic earnings figures (RoRAC: Return of Risk Adjusted Capital) and an EVA (Economic Value Added), which are subsequently indispensable for goal- and values-oriented company management.
These economic figures provide information about how much capital expenditure is necessary for the underwriting of various insurance products and how much profit is earned on the required risk capital.
Life
The risk of an individual insurance contract lies in the occurrence of the insured event. The occurrence is considered random and therefore unpredictable. The risk in life insurance outside of Austria is of minor importance due to the low volume (approximately 20.0 per cent). Various risks exist in Austria, particularly in classic life insurance. The insurance company takes on this risk for a corresponding premium paid by the policyholder. When calculating the premium, the actuary refers to the following carefully selected bases of calculation:
Interest: the actuarial interest is set so low that it can be generated with certainty in each year.
Mortality: the probabilities of dying are deliberately and carefully calculated for each type of insurance.
Costs: the costs are calculated in such a way that the costs incurred by the policy can always be covered by the premium.
The careful selection of the bases of calculation gives rise to scheduled profits, an appropriate amount of which is credited to the policyholders as part of profit sharing.
The calculation of the premium is also based on the acceptance of a large, homogenous inventory of independent risks so that the randomness inherent in an individual insurance policy is balanced out by the law of large numbers.
The following risks exist for a life insurance company:
- The bases of calculation prove to be insufficient despite careful selection.
- Random fluctuations prove disadvantageous for the insurer.
- The policyholder exercises certain implicit options to his advantage.
The risks of the insurer can be roughly divided into actuarial and financial risks.
|
Long-term life insurance policies with guaranteed interest and profit sharing |
31.12.2013 |
31.12.2012 |
|
Figures in € thousand |
|
|
|
Austria (AT) |
11,879,899 |
12,197,791 |
|
Western Europe (WE) |
2,063,940 |
1,864,220 |
|
Central Europe (CE) |
287,773 |
314,393 |
|
Eastern Europe (EE) |
35,019 |
18,238 |
|
Southeastern Europe (SEE) |
178,614 |
152,716 |
|
Russia (RU) |
68,237 |
41,200 |
|
|
14,513,483 |
14,588,559 |
|
Long-term unit-linked and index-linked life insurance policies |
31.12.2013 |
31.12.2012 |
||||||||||||||||
|
Figures in € thousand |
|
|
||||||||||||||||
|
||||||||||||||||||
|
Austria (AT) |
4,335,070 |
4,050,543 |
||||||||||||||||
|
Western Europe (WE) |
515,550 |
564,641 |
||||||||||||||||
|
Central Europe (CE) |
447,808 |
366,938 |
||||||||||||||||
|
Eastern Europe (EE) |
0 |
0 |
||||||||||||||||
|
Southeastern Europe (SEE) |
1,198 |
907 |
||||||||||||||||
|
Russia (RU) |
0 |
0 |
||||||||||||||||
|
|
5,299,625 |
4,983,029 |
||||||||||||||||
Capital and term insurance
UNIQA’s portfolio consists primarily of long-term insurance policies. Short-term assurances payable at death play a minor role.
The table below shows the distribution of the total premium by rate group and region.
|
Total premium in % |
Endowment |
Life |
Annuity |
|||
|
|
2013 |
2012 |
2013 |
2012 |
2013 |
2012 |
|
Austria (AT) |
43.9 |
38.3 |
9.0 |
7.8 |
16.1 |
13.7 |
|
Western Europe (WE) |
73.3 |
76.1 |
8.5 |
7.2 |
16.5 |
16.2 |
|
Central Europe (CE) |
20.5 |
25.8 |
3.2 |
4.4 |
0.2 |
0.3 |
|
Southeastern Europe (SEE) |
81.7 |
83.4 |
6.6 |
6.9 |
0.4 |
0.5 |
|
Eastern Europe (EE) |
49.3 |
53.3 |
21.8 |
25.5 |
0.0 |
0.0 |
|
Russia (RU) |
90.9 |
89.4 |
0.0 |
0.0 |
0.0 |
0.0 |
|
Total |
46.4 |
42.4 |
8.0 |
7.4 |
13.5 |
12.4 |
|
Total premium in % |
Unit- and index-linked |
Payment protection |
Other |
|||||||||||||||||||
|
|
2013 |
2012 |
2013 |
2012 |
2013 |
2012 |
||||||||||||||||
|
||||||||||||||||||||||
|
Austria (AT) |
30.1 |
39.5 |
0.0 |
0.0 |
0.9 |
0.7 |
||||||||||||||||
|
Western Europe (WE) |
1.8 |
0.6 |
0.0 |
0.0 |
0.0 |
0.0 |
||||||||||||||||
|
Central Europe (CE) |
55.6 |
44.9 |
7.5 |
9.6 |
13.1 |
15.0 |
||||||||||||||||
|
Southeastern Europe (SEE) |
1.5 |
1.1 |
0.9 |
1.7 |
8.8 |
6.4 |
||||||||||||||||
|
Eastern Europe (EE) |
0.0 |
0.0 |
28.9 |
21.2 |
0.0 |
0.0 |
||||||||||||||||
|
Russia (RU) |
0.0 |
0.0 |
9.1 |
10.6 |
0.0 |
0.0 |
||||||||||||||||
|
Total |
28.7 |
35.3 |
1.1 |
0.8 |
2.3 |
1.6 |
||||||||||||||||
Mortality
Insurance policies with an assurance character implicitly include a safety surcharge on the risk premium in that the premium calculation is based on an accounting table.
Using risk selection (health examinations) means that the mortality probabilities of the portfolio are consistently smaller than those of the overall population; in addition, the gradual advancement of mortality means that the real mortality probabilities are consistently smaller than the values shown in the accounting table.
Due to the large number of lives insured by the UNIQA Group in the Austrian market, the development of mortality is of particular importance here. According to the 2010/2012 mortality table published by Statistics Austria, life expectancy has increased again and is over 80 years for newborns for the first time.
|
Life expectancy at birth |
|
|
|
Mortality table |
Men |
Women |
|
1970–72 |
66.6 |
73.7 |
|
1980–82 |
69.2 |
76.4 |
|
1990–92 |
72.5 |
79.0 |
|
2000–02 |
75.5 |
81.5 |
|
2010–12 |
78.0 |
83.3 |
Homogeneity and independence of insurance risks
An insurance company takes great pains to compose a portfolio of the most homogenous, independent risks possible, in accordance with the classic, deterministic approach to calculating premiums. Because this is virtually impossible in practice, a considerable risk arises for the insurer due to random fluctuations, in particular from the outbreak of epidemic illnesses, because not only could the calculated mortality probabilities prove to be too low, the independence of the risks can also no longer be assumed.
Antiselection
The portfolios of the UNIQA Group, especially in Austria, contain large portfolios of term insurance policies with a premium adjustment clause. This allows the insurer to raise the premiums in case of a (less probable) worsening of the mortality behaviour. However, this presents the danger of possible antiselection behaviour, meaning that policies for good risks tend to be terminated while worse ones remain in the portfolio.
Retirement annuities
Mortality
The reduction of mortality probabilities represents a large uncertainty for retirement annuities. The gradual advancement of mortality as a result of medical progress and changed lifestyles is virtually impossible to extrapolate.
The attempts to predict this effect were made when producing the generation tables. However, such tables only exist for the Austrian population, and this data cannot be applied to other countries. Moreover, the past shows that the effect of these changes was seriously underestimated, which meant that subsequent reservations had to be made for retirement annuity contracts. With the exception of Austrian life insurance companies, no other relevant longevity risks exist within the UNIQA Group as barely any pension products are underwritten in regions where international business activities take place.
Antiselection
The right to choose pensions for deferred retirement annuities also results in antiselection. Only those policyholders who feel very healthy choose the annuity payment; all others choose partial or full capital payment. In this way, the pension portfolio tends to consist of mostly healthier people, i.e. worse risks than the population average.
This phenomenon is countered by corresponding modifications to the retirement mortality tables. A further possibility exists in the requirement that the intention to exercise the right to choose annuity payments must be announced no later than one year in advance of the expiration.
Financial risks
In most UNIQA companies, the actuarial interest that may be used in the calculation for writing new business is based on the maximum interest rate ordinance of the respective local supervisory authority. In any countries where the highest permitted actuarial interest is not governed by a regulation, prudent and market-appropriate assumptions are made accordingly by the actuaries responsible. The maximum interest rate in the core market of Austria is currently 1.75 per cent per annum. However, the portfolio also contains older contracts with actuarial interest rates. These are up to 4.0 per cent per annum in the UNIQA Group’s relevant markets.
The following table gives an indication of average actuarial interest rates in each region.
|
Avg. techn. interest rates, traditional business by region and currency |
EUR |
USD |
CHF |
Local |
||||||||||||||||
|
Figures in per cent |
|
|
|
|
||||||||||||||||
|
||||||||||||||||||||
|
Austria (AT) |
2.6 |
- |
- |
- |
||||||||||||||||
|
Western Europe (WE) |
2.5 |
- |
1.9 |
- |
||||||||||||||||
|
Central Europe (CE) |
3.8 |
- |
- |
3.3 |
||||||||||||||||
|
Southeastern Europe (SEE) |
3.3 |
- |
- |
3.3 |
||||||||||||||||
|
Eastern Europe (EE) |
2.5 |
- |
- |
3.5 |
||||||||||||||||
|
Russia (RU) |
3.0 |
3.0 |
- |
4.0 |
||||||||||||||||
Since these interest rates are guaranteed by the insurance company, the financial risk lies in not being able to generate these returns. Since classic life insurance predominantly invests in interest-bearing titles (debenture bonds, credits etc.), the unpredictability of long-term interest rate trends is the most significant financial risk for a life insurance company. The interest risk weighs especially heavily on retirement annuities, because these are extremely long-term policies.
The interest risk functions in the following ways:
Investment and reinvestment risk
Premiums received in the future must be invested at an interest rate guaranteed at the time the policy was taken out. However, it is entirely possible that no corresponding titles are available at the time the premium is received. In the same way, future income must be reinvested at the actuarial interest rate.
Asset liability management
For practical reasons, the goal of cash flow matching of assets and liabilities cannot be fully achieved. The duration of the life insurance assets is 5.8 (2012: 5.0), while for liabilities it is considerably longer. This is called the “duration gap”, which results in interest rate risk that must be backed with capital in the ECR model.
Value of implicit options
Life insurance policies contain implicit options that can be exercised by the policyholder. While the possibilities of partial or full buy-back or the partial or full release of premiums in fact represent financing options, these options are not necessarily exercised as a consequence of correct, financially rational decisions. However, in the case of a mass buy-back, for example due to an economic crisis, this represents a considerable risk to the insurance company. The question of whether a capital or an annuity option should be exercised is, in addition to subjective motives of the policyholder, also characterised by financially rational considerations; depending on the final interest level, a policyholder will opt for the capital or the annuity, which means that these options represent a considerable (cash) value for the policyholder and therefore a corresponding risk for the insurer.
The guarantee of an annuitising factor represents another financial risk. Here, the insurance company guarantees to annuitise a sum unknown in advance (namely the value of the fund shares at maturity or, for classic life insurance, the value of the insured sum including profit-sharing) in accordance with a mortality table (the risk involved is not exclusively financial) and an interest rate set at the time the policy is taken out.
Besides these actuarial and financial risks, the cost risk must also be specified. The insurer guarantees that it will deduct only the calculated costs for the entire term of the policy. The business risk here is that the cost premiums are insufficient (e.g. due to cost increases resulting from inflation).
Market Consistent Embedded Value sensitivity analyses for the life and health insurance business
In the UNIQA Group, Market Consistent Embedded Value is calculated according to the Market Consistent Embedded Value Principles defined by the CFO Forum and according to the “Basis for Conclusions” published in October2009. Embedded value comprises assets by fair value and the present value of the insurance business. The present value is the present value of distributable profits after taxes less cost of capital. The Market Consistent Embedded Value is an actuarial valuation of an insurance company assuming it is a going concern, explicitly excluding the value of future new business.
The assumptions underlying the projection to determine the present value are based on the best estimate approach, i.e. a realistic estimate of operating and economic assumptions on the basis of future expectations and historical observations. An embedded value calculation involves many economic and operating assumptions, which UNIQA rates as reasonable and sensible but which cannot be predicted with certainty due to numerous influencing factors outside the company’s control. For this reason, the actual developments can differ materially from the expected profits in the measurement of embedded value.
Shareholders’ interest is calculated under consideration of all available sources of income, whereby in traditional life insurance in Austria, the profit participation regulation is paid particular attention. The most realistic possible development of future profit sharing is also assumed under the legal conditions in all other evaluated countries. The projected profits are influenced by assumptions regarding mortality, cancellation, costs, capital selection, inflation and investment income.
The assumed interest rate depends on the capital market on the measurement date and is derived via the current derivation method for yield curves under Solvency II. In order to estimate the effects of the assumed interest rate, two sensitivities of the interest rate curve were calculated in the embedded value, with +/‑100 basis points being applied to the capital market data of the interest rates. For assumed interest rates according to the latest liquid market data, convergence to a long-term interest rate level of 4.2 per cent is assumed within 40 years. This corresponds with the current EIOPA standards on the derivation method for risk-free interest rates and is also applied to the sensitivity calculations, so the latter do not exclusively relate to parallel shifts of the interest rate curve.
The sensitivities indicated below relate only to those companies in the UNIQA Group that are evaluated via projections (Austria, Italy, Czech Republic, Slovakia, Hungary, Poland, Russia). As of 31 December 2013, this evaluation covers more than 98.0 per cent of the reserve of the UNIQA Group’s life business. As of 31 December 2012, the sensitivities were measured excluding the Russian subsidiary:
|
Sensitivities of Market Consistent Embedded Value |
2013 |
2012 |
|
Change in per cent of basic value |
|
|
|
Equity and property –10 % |
–5.01 |
–8.03 |
|
Interest rate +1 % |
4.98 |
14.13 |
|
Interest rate –1 % |
–10.08 |
–18.13 |
|
Cost rate –10 % |
2.22 |
3.26 |
|
Lapse rate –10 % |
1.75 |
1.34 |
|
Mortality and health endowment +5 % |
1.33 |
1.36 |
|
Mortality annuities +5 % |
–0.14 |
–0.29 |
Health
The health insurance business is operated primarily in Austria (92.0 per cent domestic and 8.0 per cent international). As a result, the focus lies on risk management in Austria.
Health insurance is a loss insurance calculated under consideration of biometric risks and is operated in Austria “similarly to life insurance”.
Terminations by the insurer are not possible except in the case of obligation violations by the insured. Premiums must therefore be calculated in such a way that the premiums are sufficient to cover the insurance benefits that generally increase with age, assuming probabilities that remain constant. The probabilities and cost structures can change frequently over time. For this reason, it is possible to adjust the premiums for health insurance as necessary to the changed bases of calculation.
When taking on risks, the existing risk of the individual is also evaluated. If it is established that an illness already exists for which the cost risk is expected to be higher than for the calculated portfolio, then either this illness is excluded from the policy, an adequate risk surcharge is demanded or the risk is not underwritten.
In health insurance, assurance coverage (“ageing provision”) is built up through calculation according to the “type of life insurance” and reduced again in later years because this is used to finance an ever larger part of the benefits that increase with age.
The actuarial interest rate for this actuarial provision is 3.0 per cent. If 3.0 per cent is not achieved by the investment, premiums contain safety margins that may be used in the event of insufficient investment results. As an FMA guideline regarding actuarial interest in health insurance was issued in October 2013, from 1 January 2014 new business is calculated with an actuarial interest rate of 2.5 per cent. This results in an improvement of the risk of insufficient investment results.
The legal risks arise primarily from the effects that changes to legislation have on the existing private health insurance business model. This includes, in particular, changes to the legal framework that make it harder or impossible to adapt to changed circumstances or that sharply reduce the income opportunities. Developments in this area will be observed by the insurance association, and an attempt will be made where necessary to react to negative developments from the perspective of the private health insurer.
The EU Directive on the equal treatment of men and women in insurance, which is implemented in Austria by the Insurance Amendment Act 2006 (VersRÄG 2006), was also taken into account in the calculation of premiums at the end of the second quarter of 2007. This means that the costs of birth and pregnancy had to be distributed across both sexes. No significant risk to profit has been identified here.
In the meantime, a decision reached by the European Court of Justice regarding insurance policies resulted in a new situation as of 21 December 2012. By this point in time, only completely identical premiums are allowed for men and women, excluding considerations such as age and individual pre-existing conditions. Experience in 2013 has shown that no negative development of the portfolio structure of new business has resulted.
The risk of the health insurance business outside Austria is dominated primarily by UNIQA Assicurazioni in Milan (approximately € 33.0 million in annual premiums). This company currently has stable holdings, meaning that actuarial risk scarcely changes. For tariffs with an outdated calculation basis, with aging holdings, the insured will be converted to tariffs with a modern calculation basis in the coming years. Because this affects tariffs that are not life-long, the conversion problem is less significant than it is for life-long tariffs.
The remaining premiums (approximately € 42.0 million) are divided among multiple companies and are of only minor importance there. Only in Switzerland (Geneva) is health insurance the primary business (approximately € 8.3 million); however, the Swiss Solvency Test resulted in sufficient risk capital.
Life-long health insurance policies without termination options by the insurer rarely exist outside of Austria, meaning that the risk can be considered low for this reason as well.
Other risks
Operational risks
Operational risks include losses that are caused by insufficient or failed internal processes, as well as losses caused by systems, personnel resources or external events.
Operational risk includes legal risk, but not reputation and strategic risk. Legal risk is the risk of uncertainty due to complaints or uncertainty in the applicability or interpretation of contracts, laws or other legal requirements.
The UNIQA Group’s risk management process also defined the risk process for operational risks in terms of methodology, expiration and responsibilities. The risk manager is responsible for compliance in all subsidiaries.
The particularity of operational risks is that they can surface in all processes and departments. This is why operational risks are identified and evaluated in every operational company at a very broad level in the UNIQA Group. Risk identification is carried out with the aid of a standardised risk catalogue that is regularly checked for completeness. Scenarios are defined for evaluating these risks; these scenarios are designed to convey the likelihood of occurrence and the amount of damages. The results are then presented by the risk manager in the form of an aggregated risk report.
This process is conducted twice a year on a standard basis.
Reputation and strategic risks
Reputation risk describes the risk of loss that arises due to possible damage to the company’s reputation, deterioration in prestige, or a negative overall impression due to negative perception by customers, business partners, shareholders or supervisory agencies.
Reputation risks that occur during the course of core processes such as claims processing or advising and service quality are identified, evaluated and managed as operational risks in our subsidiaries.
The most important reputation risks are presented, like operational risks, in an aggregated form in the risk report.
Group risk management then analyses whether the risk observed in the Group or in another unit may occur, and whether the danger of “contagion” within the Group is possible.
Strategic risk describes the risk that results from management decisions or insufficient implementation of management decisions that may influence current/future income or solvency. This includes the risk that arises from management decisions that are inadequate because they ignore a changed business environment.
Like operational and reputation risks, strategic risks are evaluated twice a year. Furthermore, important decisions in various committees, such as the Risk Committee, are discussed with the Management Board. As outlined in the explanation of the risk management process, the management receives a monthly update regarding the most significant risks in the form of a heat map.