UNIQA Group is one of the leading insurance groups in its two core markets: Austria and Central and Eastern Europe (CEE).
About 21,000 employees and exclusive sales partners serve about 10 million customers across 19 countries. Commanding a market share of more than 21 per cent, UNIQA is the second largest insurance group in Austria. In the growth region CEE, UNIQA is present in 15 markets: Albania, Bosnia and Herzegovina, Bulgaria, Croatia, Czech Republic, Hungary, Kosovo, Macedonia, Montenegro, Poland, Romania, Russia, Serbia, Slovakia and Ukraine. In addition, insurance companies in Italy, Switzerland, and Liechtenstein are also part of the UNIQA Group.
UNIQA Group at a glance
Consolidated key figures in € million |
2015 |
2014 |
Change |
||||||||
|
|||||||||||
Premiums written |
5,839.7 |
5,519.7 |
5.8% |
||||||||
Savings portions from unit-linked and index-linked life insurance (before reinsurance) |
485.4 |
544.7 |
–10.9% |
||||||||
Premiums written including savings portions from unit-linked and index-linked life insurance |
6,325.1 |
6,064.4 |
4.3% |
||||||||
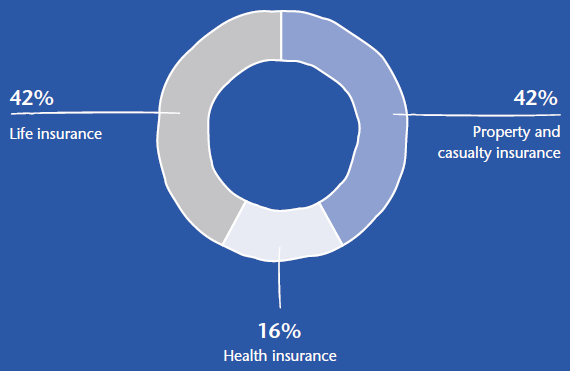
of which property and casualty insurance |
2,641.4 |
2,620.9 |
+0.8% |
||||||||
of which health insurance |
997.9 |
960.8 |
+3.9% |
||||||||
of which life insurance |
2,685.8 |
2,482.7 |
+8.2% |
||||||||
of which income from regular premiums |
1,491.9 |
1,521.0 |
–1.9% |
||||||||
of which single premiums |
1,194.0 |
961.6 |
+24.2% |
||||||||
Premiums written including savings portions from unit-linked and index-linked life insurance |
6,325.1 |
6,064.4 |
4.3% |
||||||||
of which UNIQA Österreich |
2,807.7 |
2,773.5 |
+1.2% |
||||||||
of which Raiffeisen Insurance |
1,075.8 |
905.3 |
+18.8% |
||||||||
of which UNIQA International |
2,416.8 |
2,353.1 |
+2.7% |
||||||||
of which reinsurance |
1,112.1 |
1,189.3 |
–6.5% |
||||||||
of which Group functions and consolidation |
–1,087.3 |
–1,156.9 |
–6.0% |
||||||||
|
|
|
|
||||||||
Premiums earned (net)1) |
5,633.5 |
5,312.9 |
6.0% |
||||||||
of which property and casualty insurance |
2,500.2 |
2,482.9 |
+0.7% |
||||||||
of which health insurance |
997.1 |
960.0 |
+3.9% |
||||||||
of which life insurance |
2,136.2 |
1,870.0 |
+14.2% |
||||||||
Savings portions from unit-linked and index-linked life insurance (after reinsurance) |
469.3 |
526.1 |
–10.8% |
||||||||
Premiums earned including savings portions from unit-linked and index-linked life insurance |
6,102.8 |
5,839.0 |
4.5% |
||||||||
|
|
|
|
||||||||
–4,607.6 |
–4,383.7 |
5.1% |
|||||||||
of which property and casualty insurance |
–1,695.2 |
–1,723.6 |
–1.6% |
||||||||
of which health insurance |
–801.2 |
–780.5 |
+2.6% |
||||||||
of which life insurance |
–2,111.2 |
–1,879.6 |
+12.3% |
||||||||
|
|
|
|
||||||||
Operating expenses (net)2) |
–1,298.7 |
–1,299.1 |
– |
||||||||
of which property and casualty insurance |
–750.5 |
–748.9 |
+0.2% |
||||||||
of which health insurance |
–164.7 |
–167.1 |
–1.4% |
||||||||
of which life insurance |
–383.5 |
–383.1 |
+0.1% |
||||||||
Cost ratio (after reinsurance) |
21.3% |
22.2% |
– |
||||||||
|
|
|
|
||||||||
Combined ratio (after reinsurance) |
97.8% |
99.6% |
– |
||||||||
|
|
|
|
||||||||
Net investment income |
831.1 |
888.2 |
–6.4% |
||||||||
|
|
|
|
||||||||
Earnings before taxes |
422.8 |
377.9 |
11.9% |
||||||||
Profit/(loss) |
334.6 |
292.9 |
14.2% |
||||||||
Consolidated profit/(loss) |
331.1 |
289.9 |
14.2% |
||||||||
|
|
|
|
||||||||
Return on equity (ROE) after taxes and non-controlling interests |
10.6% |
9.9% |
– |
||||||||
|
|
|
|
||||||||
Investments3) |
29,416.1 |
29,024.9 |
1.3% |
||||||||
Equity |
3,152.7 |
3,082.2 |
+2.3% |
||||||||
Total equity including non-controlling interests |
3,174.8 |
3,102.4 |
2.3% |
||||||||
Technical provisions (net)4) |
25,410.9 |
25,629.6 |
–0.9% |
||||||||
Total assets |
33,078.4 |
33,038.2 |
0.1% |
||||||||
|
|
|
|
||||||||
Number of insurance contracts |
19,254,690 |
19,214,570 |
+0.2% |
||||||||
Average number of employees |
14,113 |
14,336 |
–1.6% |
||||||||
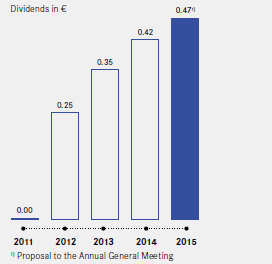
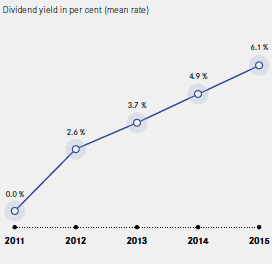
History of UNIQA dividends
 |
 |
UNIQA share performance
")
UNIQA shares – key figures
In € |
2015 |
2014 |
2013 |
2012 |
2011 |
||
|
|||||||
UNIQA share price as at 31 December |
7.53 |
7.78 |
9.28 |
9.86 |
9.42 |
||
High |
9.41 |
10.02 |
11.14 |
13.40 |
16.50 |
||
Low |
7.04 |
7.34 |
8.12 |
8.75 |
9.00 |
||
Average daily turnover (in € million) |
4.5 |
3.2 |
1.5 |
0.1 |
0.1 |
||
Market capitalisation as at 31 December (in € million) |
2,326.8 |
2,404.0 |
2,867.5 |
2,112.5 |
1,346.9 |
||
1.07 |
0.94 |
1.21 |
0.75 |
-1.73 |
|||
Dividend per share |
0.471) |
0.42 |
0.35 |
0.25 |
0 |
||
Balanced portfolio