Business segments
Life insurance
Premiums rose by more than 10%
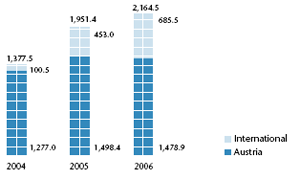
Premium volume written in life insurance incl. the savings portion
of premiums from unit- and index-linked life insurance increased
in the past year by 10.9% to € 2,164.5 million (2005:
€ 1,951.4 million).
In Austria, premium volume sank 1.3% to € 1,478.9 million
(2005: € 1,498.4 million) due to higher expirations in the area
of bank sales and the deliberate withdrawal of single-premium
business. On the other hand, revenues from policies with recurring
premium payments rose by 4.1% to € 1,287.5 million
(2005: € 1,236.4 million). Although the development of premiums
was influenced by the loss of recurring premiums from
policies with abbreviated premium payment periods, there was
the same amount of new business in the past financial year as in
the year before. The international Group companies were able to
clearly increase the premiums from life insurance. In the CEE and
NEEM regions premium volume written rose, incl. the savings portion of premiums from unit- and index-linked life insurance,
by 77.1% to € 210.1 million (2005: € 118.6 million). The share
of life insurance from these countries thus already amounted to
€ 9.7% in 2006 (2005: 6.1%). In the Western European Markets
(WEM) premium volume increased thanks to the booming Italian
business by 42.2% to € 475.5 million (2005: € 334.4 million)
– that was a 22.0% (2005: 17.1%) share of the Group’s total
life insurance premiums.
The risk premium portion of unit- and index-linked life insurance
included in the consolidated financial statements totalled € 67.3
million in 2006 (2005: € 55.2 million). The savings portion of
premiums from unit- and index-linked life insurance amounted
to € 559.3 million (2005: € 360.2 million) and was, in accordance
with FAS 97 (US-GAAP), balanced out by the changes in
the actuarial provision.
The earned premium income from the life insurance sector of
the UNIQA Group increased by 0.3% in 2006 to € 1,527.4 million
(2005: € 1,523.3 million).
| Premiums written |
1,605.2 |
1,591.2 |
1,199.3 |
| Savings portion of premiums from unit- and index-linked life insurance |
559.3 |
360.2 |
178.2 |
| Share CEE & NEEM |
9.7% |
6.1% |
5.2% |
| Share WEM |
22.0% |
17.1% |
2.1% |
| Premiums earned |
1,527.4 |
1,523.3 |
1,166.1 |
| Net investment income |
610.3 |
731.3 |
580.1 |
| Insurance benefits |
1,779.8 |
1,897.7 |
1,450.6 |
| Acquisition expenses less reinsurance commissions |
188.5 |
157.0 |
148.1 |
| Other operating expenses |
72.9 |
87.1 |
82.5 |
| Cost ratio (after reinsurance) |
12.9% |
13.3% |
17.8% |
| Administrative cost ratio |
3.6% |
4.7% |
6.4% |
| Profit on ordinary activities |
56.0 |
68.8 |
38.6 |
| Net profit |
36.7 |
44.5 |
29.0 |
Development of insurance benefits
The retained insurance benefits (expenditure for claims incurred,
expenditure for increased actuarial provision as well as provisions
for premium refunds and profit sharing) decreased by 6.2% to
€ 1,779.8 million (2005: € 1,897.7 million).
In Austria, insurance benefits even decreased by 9.5% to
€ 1,448.2 million (2005: € 1,599.6 million). In 2005, one-time
additional provisions were made for retirement annuities due to
the adjustment of the Austrian mortality tables. In CEE & NEEM
insurance benefits rose in life insurance by 13.6% to € 87.4
million (2005: € 76.9 million), in WEM by 10.4% to € 244.2
million (2005: € 221.3 million).
Operating expenses
Consolidated operating expenses in life insurance less reinsurance
commissions and profit shares from reinsurance business
ceded rose in 2006, by 7.1% to € 261.4 million (2005: € 244.1
million). While acquisition expenses went up due to the high
level of new business 20.1% to € 188.5 million (2005: € 157.0
million), other operating expenses decreased by an impressive
16.3% to € 72.9 million (2005: € 87.1 million).
As a result of this development the cost ratio of life insurance,
i.e. the relation of total operating expenses to the Group premiums
earned, including the savings portion of premiums from
unit- and index-linked life insurance, decreased to 12.9% (2005:
13.3%). The administrative cost ratio also decreased in 2006
and amounted to 3.6% (2005: 4.7%).
Investment results
Net investment income less financing costs sank in the reporting
year, by 16.5% to € 610.3 million (2005: € 731.3 million).
The UNIQA Group’s life insurance investment portfolio increased
by 9.5% to € 15,744.7 million in 2006 (2005: € 14,381.0 million).
Premium volume written in life insurance
incl. the savings portion of premiums from unit- and index-linked
life insurance
in € million |
|
Profit on ordinary activities, net profit
In life insurance, profit on ordinary activities came to € 56.0
million in 2006 (2005: € 68.8 million). Net profit was down by
17.6% to € 36.7 million (2005: € 44.5 million). |
Health insurance
Premiums up by more than 5% in 2006
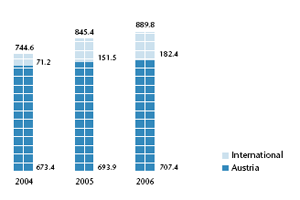
In comparison to the previous year, premiums written in health
insurance increased by 5.3% to € 889.8 million (2005: € 845.4
million).
Premium volume written in health insurance
in € million |
|
|
In Austria, where UNIQA is the clear no. 1 in the health insurance
market, a premium volume of € 707.4 million (2005: € 693.9
million) was achieved in 2006. This was an increase of 2.0%.
In the WEM region, health insurance premiums rose 19.9% to
€ 179.5 million (2005: € 149.7 million), because Mannheimer
Krankenversicherung had only been included in the consolidated
financial statements for three quarters in 2005. In the
Western European markets, the share of the total premiums in
health insurance rose from 17.7% to 20.2%. In the countries
in Eastern and South-Eastern Europe, private health insurance
still plays a secondary role.
In 2006, 4.4% more premiums were earned in health insurance,
amounting to € 886.7 million at the end of the year (2005:
€ 849.4 million).
| Premiums written |
889.8 |
845.4 |
744.6 |
| Share CEE & NEEM |
0.3% |
0.2% |
0.2% |
| Share WEM |
20.2% |
17.7% |
9.4% |
| Premiums earned |
886.7 |
849.4 |
742.1 |
| Net investment income |
113.8 |
100.9 |
81.5 |
| Insurance benefits |
805.8 |
773.1 |
675.3 |
| Acquisition expenses less reinsurance commissions |
86.8 |
78.3 |
66.6 |
| Other operating expenses |
49.9 |
52.6 |
52.9 |
| Cost ratio (after reinsurance) |
15.4% |
15.4% |
16.1% |
| Administrative cost ratio |
5.6% |
6.2% |
7.1% |
| Profit on ordinary activities |
53.7 |
40.6 |
23.6 |
| Net profit |
34.8 |
34.7 |
20.2 |
Development of insurance benefits
Retained insurance benefits rose due to the increased amount
of business by 4.2% to € 805.8 million (2005: € 773.1 million).
In Austria, insurance benefits rose only very slightly compared
to the increase in premiums; by 0.7% to € 644.5 million
(2005: € 639.7 million). In the international health insurance
line insurance benefits rose by 21.0% to € 161.3 million (2005:
€ 133.4 million).
Operating expenses
In 2006, total operating expenses increased slightly by 4.4% to
€ 136.7 million (2005: € 130.9 million). Acquisition expenses
rose by 10.9% to € 86.8 million (2005: € 78.3 million). In health
insurance it was also possible to reduce the other operating expenses.
Despite the rise in premium revenue these expenses sank
by 5.2% to € 49.9 million (2005: € 52.6 million).
In 2006, the cost ratio in health insurance remained at 15.4%,
the same level as the previous year (2005: 15.4%). However, the
administrative cost ratio decreased from 6.2% to 5.6%.
Investment results
Net investment income less financing costs rose in 2006, by
12.8% to € 113.8 million (2005: € 100.9 million). In health
insurance capital investments increased by 2.0% to € 2,067.3
million (2005: € 2,026.7 million).
Profit on ordinary activities, net profit
Profit on ordinary activities in health insurance rose again in
the reporting year by 32.1% to € 53.7 million (2005: 40.6 million).
Because of an extraordinary tax effect in 2005, net profit
remained, with a rise of 0.2% to € 34.8 million, at basically the
same level as the previous year (2005: € 34.7 million).
Property and casualty insurance
Premiums written over € 2 billion for the first time
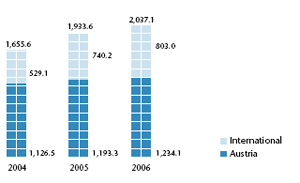
In the property and casualty line UNIQA was able to increase premium volume written in the past year by 5.4% to € 2,037.1 million (2005: € 1,933.6 million).
|
Premium volume written in
property and casualty insurance
in € million |
|
|
Premium volume in Austria was up, despite the stiffer competition, by 3.4% to € 1,234.1 million (2005: € 1,193.3 million). In the CEE & NEEM regions growth was clearly higher in 2006. The premium volume written jumped up 18.0% to € 426.8 million (2005: € 361.8 million), thus already contributing 21.0% (2005: 18.7%) to Group premiums in property and casualty. On the markets in Western Europe premium volume written sank slightly in 2006, by 0.6% to € 376.2 million (2005: € 378.5 million). That represents a share of 18.5% (2005: 19.6 %).
Details on premium volume written in the most important business lines can be found in the notes to the consolidated financial statements (cf. note no. 30).
Premiums earned in the property and casualty line amounted to € 1,715.6 million (2005: € 1,627.7 million) at the end of the year, which was 5.4% more than in 2005.
| Premiums written |
2,037.1 |
1,933.6 |
1,655.6 |
| Share CEE & NEEM |
21.0% |
18.7% |
18.6% |
| Share WEM |
18.5% |
19.6% |
13.4% |
| Premiums earned |
1,715.6 |
1,627.7 |
1,393.5 |
| Net investment income |
140.9 |
130.7 |
89.5 |
| Insurance benefits |
1,130.1 |
1,106.1 |
907.5 |
| Loss ratio (after reinsurance) |
65.9% |
68.0% |
65.1% |
| Loss ratio (before reinsurance) |
64.1% |
66.4% |
63.6% |
| Acquisition expenses less reinsurance commissions |
352.3 |
343.8 |
302.4 |
| Other operating expenses |
216.6 |
208.9 |
176.9 |
| Cost ratio (after reinsurance) |
12.9% |
13.3% |
17.8% |
| Administrative cost ratio |
12.6% |
12.8% |
12.7% |
| Combined ratio (after reinsurance) |
99.0% |
101.9% |
99.5% |
| Combined ratio (before reinsurance) |
95.4% |
98.2% |
95.8% |
| Profit on ordinary activities |
128.8 |
80.9 |
58.6 |
| Net profit |
103.7 |
54.2 |
52.6 |
Development of insurance benefits
The rise in total retained insurance benefits in the property and casualty line in 2006 was, despite the harsh winter and the claims relating to heavy snow loads, only a very moderate 2.2% to € 1,130.1 million (2005: € 1,106.1 million). In Austria, insurance benefits decreased by 0.9% to € 714.7 million (2005: € 721.0 million), in the Western European Markets even by 2.7% to € 178.1 million (2005: € 183.1 million). In the CEE and NEEM regions, insurance benefits were up 17.4% to € 237.2 million because of the increased volume of business (2005: € 202.0 million).
As a result of this positive trend, the consistent implementation of reorganisation measures and risk-oriented underwriting policies the net loss ratio (retained insurance benefits relative to premiums earned) sank by 2.1 percentage points to 65.9% (2005: 68.0%). At the end of 2006, the gross loss ratio (before reinsurance) was even lower, at 64.1% (2005: 66.4%).
The level of reserves in property and casualty insurance (total retained claims provisions in relation to earned premiums) rose slightly, reaching 110.9% (2005: 109.4%) at the end of 2006.
Operating expenses, combined ratio
Total operating expenses increased in the property and casualty insurance line – below average, compared to premiums – by 2.9% to € 568.9 million (2005: € 552.8 million). In the process, acquisition costs rose by 2.5% to € 352.3 million (2005: € 343.8 million), other operating expenses increased by 3.7% to € 216.6 million (2005: € 208.9 million).
The cost ratio in property and casualty insurance sank in the past financial year to 33.2% (2005: € 34.0%). The administrative cost ratio diminished slightly, falling to 12.6% (2005: 12.8%).
The combined ratio was successfully reduced in 2006, and amounted to 99.0% (2005: 101.9%). The combined ratio before reinsurance was even lowered to 95.4% (2005: 98.2%).
Investment results
Net income from investments less financing costs rose in the past year by 7.8% to € 140.9 million (2005: € 130.7 million). The investment portfolio increased in property and casualty insurance by 13.0% to € 3,343.1 million (2005: € 2,959.6 million).
Profit on ordinary activities, net profit
Profit on ordinary activities increased in property and casualty insurance in 2006, by 59.2% to € 128.8 million (2005: € 80.9 million). Net profit almost doubled, increasing by 91.3% to € 103.7 million (2005: € 54.2 million).
International markets
Above average growth in 2006 as well
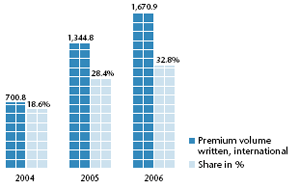
The international premium volume of the UNIQA Group rose
sharply in the past financial year, due to strong organic growth
and the acquisition of companies in Eastern and South-Eastern
Europe. Premium volume written in the international Group
companies incl. the savings portion of premiums from unitand
index-linked life insurance climbed in 2006, by 24.3% to
€ 1,670.9 million (2005: € 1,344.8 million). This brought the
international share of Group premiums up to 32.8% (2005:
28.4%). Premiums earned rose 12.0% to € 1,213.3 million
(2005: € 1,083.4 million).
The premium volume written incl. the savings portion of premiums
>from unit- and index-linked life insurance was divided
as follows amongst the various regions and countries in the
UNIQA Group:
| Poland |
197.7 |
177.1 |
117.9 |
3.9 |
| Czech Republic |
110.9 |
95.6 |
87.7 |
2.2 |
| Slovakia |
56.8 |
51.9 |
45.9 |
1.1 |
| Hungary |
203.9 |
138.5 |
120.3 |
4.0 |
| Croatia |
15.0 |
12.3 |
9.4 |
0.3 |
| Bosnia and Herzegovina |
10.8 |
6.9 |
0 |
0.2 |
| Central Eastern Europe (CEE) |
595.0 |
482.2 |
381.1 |
11.7 |
| Bulgaria |
42.0 |
0 |
0 |
0.8 |
| Serbia |
2.8 |
0 |
0 |
0.1 |
| New Eastern Emerging Markets (NEEM) |
44.8 |
0 |
0 |
0.9 |
| Germany |
394.7 |
371.6 |
122.2 |
7.8 |
| Switzerland2) |
41.2 |
49.7 |
63.8 |
0.8 |
| Liechtenstein |
15.6 |
13.1 |
26.4 |
0.3 |
| Italy |
579.7 |
428.2 |
107.2 |
11.4 |
| Western European Markets (WEM) |
1,031.1 |
862.6 |
319.7 |
20.3 |
| Total international |
1,670.9 |
1,344.8 |
700.8 |
32.8 |
International premium volume written
in € million |
|
|
Total insurance benefits in the international Group companies
increased 11.2% in 2006, to € 908.3 million (2005: € 816.6
million). Consolidated operating expenses less reinsurance commissions
and profit shares from reinsurance business ceded rose
in the past financial year by 17.6% to € 346.1 million (2005:
€ 294.2 million).
In 2006, before consolidation based on the geographic segments
(cf. segment reports), profit on ordinary activities generated by
the companies in the three regions outside of Austria amounted
to € 64.5 million (2005: € 63.2 million). This amounted to a
share of the Group results of 27.0% (2005: 33.2%).


 Group Management Report
 Business segments

 Content
 Topics
 Search


